Figure 4.
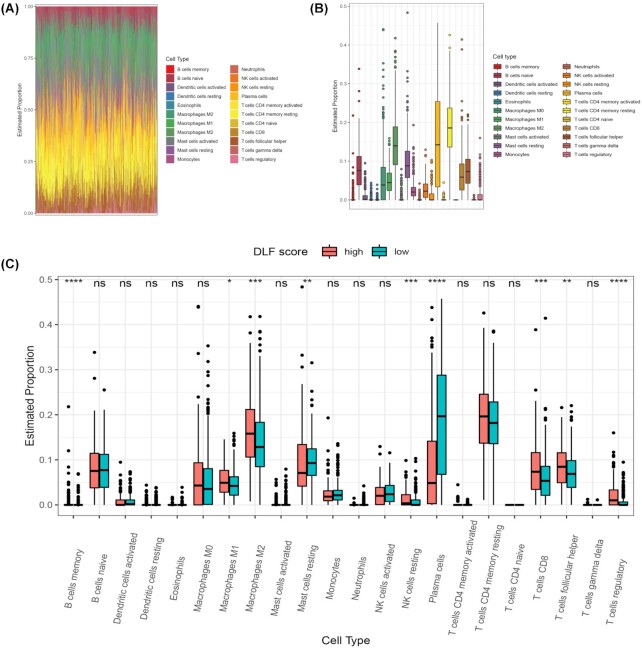
Tumor microenvironment analysis in the TCGA cohort. (A) Different immune cells in the tumor microenvironment. (B) Different abundances of each immune cell types in prostate cancer. (C) The difference in the proportion of immune cells between the high-score group and the low-score group. TCGA, the cancer genome atlas; DLFscore, deep learning-based ferroptosis score; HR, hazard ratio. *P < 0.05; **P < 0.01; ***P < 0.001; ****P < 0.0001; ns: no significance.

