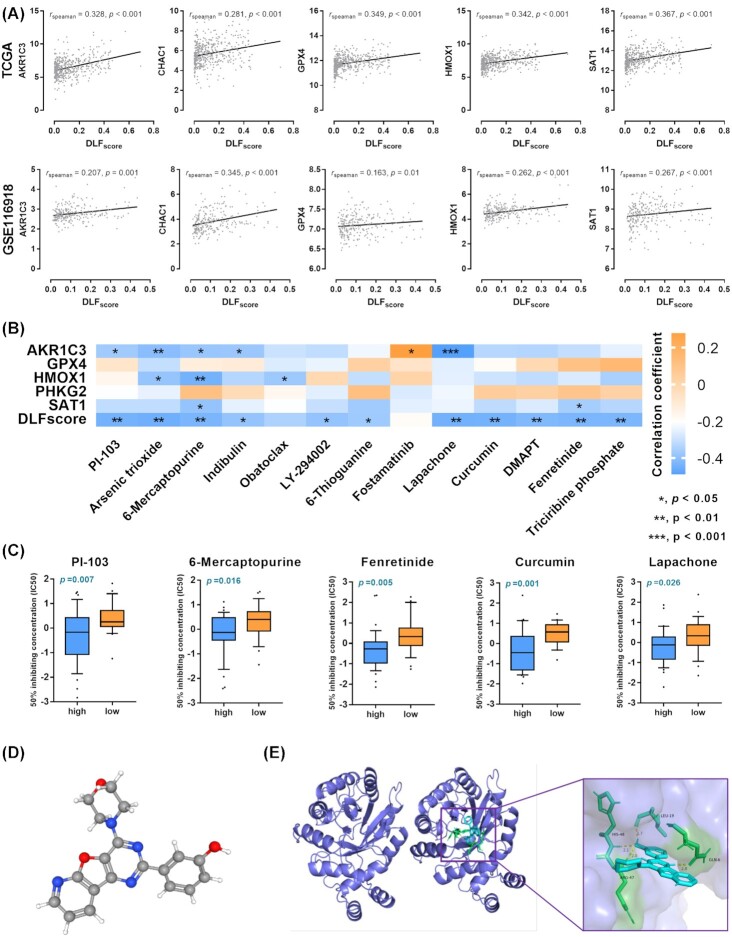
Figure 6.
Prediction of therapeutic agents for use in ferroptosis regulation. (A) Correlation analysis of DLFscore and ferroptosis-related gene expression. (B) Correlation analysis of the compound activity of drugs and ferroptosis-related genes and DLFscore in the NCI 60 cell line. (C) Comparison of drug sensitivity between prostate cancer cell lines with high and low DLFscore. (D) The molecular structure of PI-103. (E) The docking result of the active components to AKR1C3. Diagram of the cyclophosphamide and protein combination. IC50, half-maximal inhibitory concentration; *P < 0.05; **P < 0.01; DLFscore, deep learning-based ferroptosis score.

