
Figure 3.
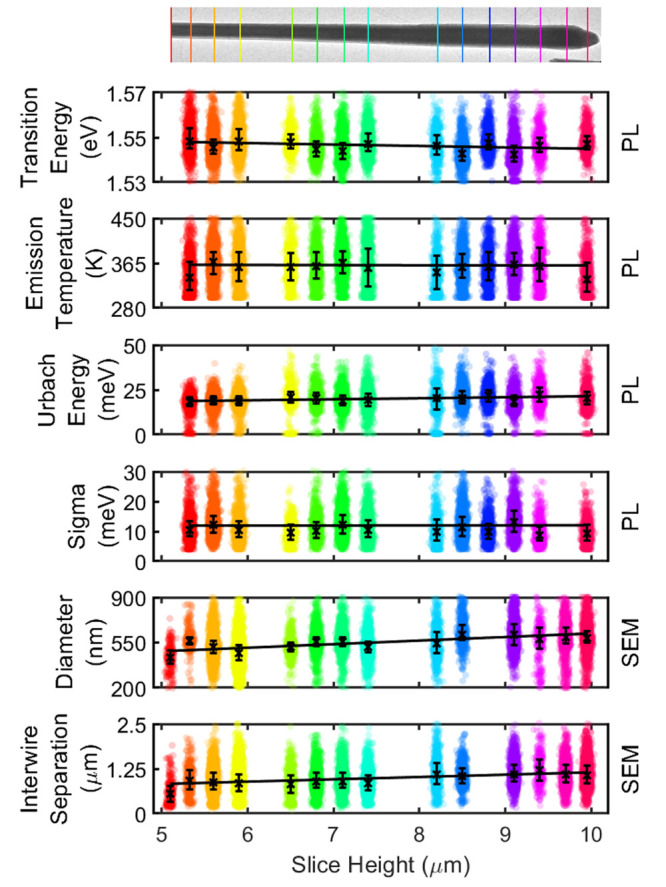
Swarm plot of properties obtained from the LSW fitting of PL spectra and SEM data. The transmission electron microscopy image (top) serves as a guide for the slice height along the NW. Black crosses are median values, with error bars representing the IQR. Best fit lines are shown as a function of slice height, and errors are referenced by 95% confidence bands in the text.