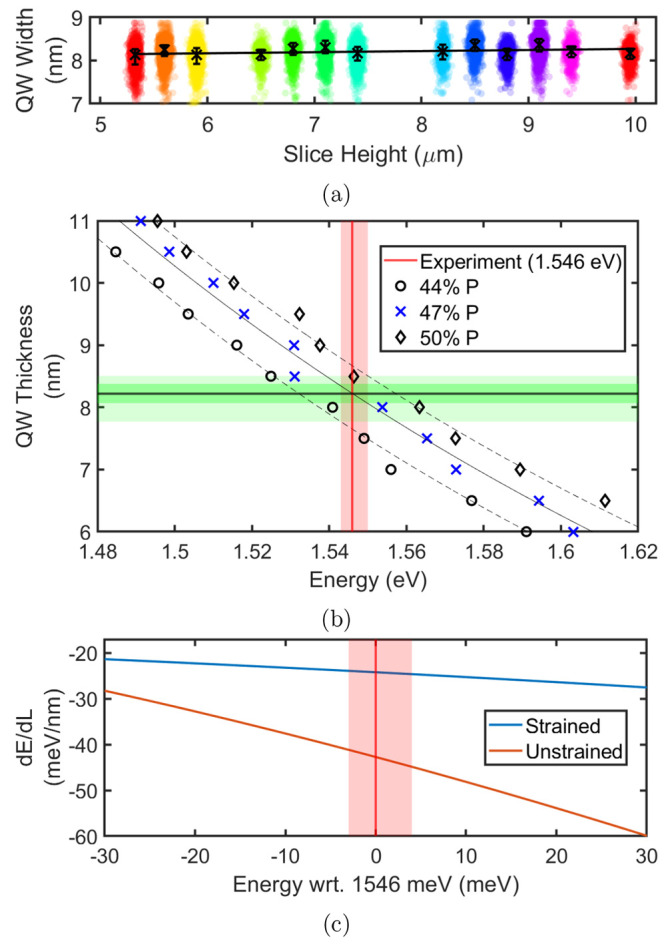
Figure 4.

(a) Swarm plot of QW width calculated from the Nextnano simulation along the NW length. (b) Simulation sweeps of QW width and transition energy, used to extract QW widths from experimentally observed transition energies. Models for 44%, 47%, and 50% P-composition in the GaAs0.53P0.47 barriers affect the intramaterial strain and hence shift the QW energies. The dark green overlay represents the IQR of the extracted widths from our statistical analysis for P = 47%, whereas the light green extends to account for other P-compositions. (c) Gradient of the fit shown in (b) for strained and unstrained (data not shown) versions of the structure with GaAs0.53P0.47 barriers, showing the reduced emission dependence on QW width (and hence energy) due to strain.
