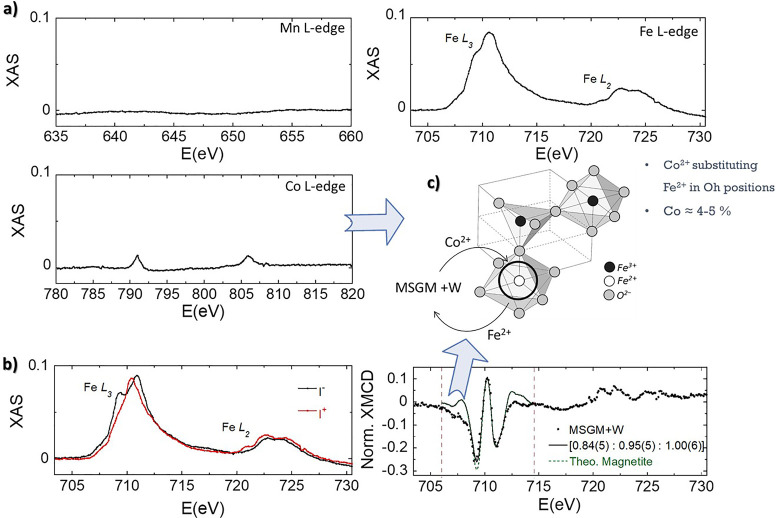
Figure 3.
(a) Nonmagnetic contribution of XAS spectra for MSGM + W, (I+ + I–)/2, measured at Fe, Mn, and Co L-edges in the transmission mode at 300 K. XAS signal obtained for MSGM + W measured at Fe L-edge. (b) Computing I+ – I– gives the XMCD signal. Spectra have been normalized by the peak intensity at the L3-edge of nonmagnetic XAS. The continuous line presents the best theoretical simulation of the Fe L3-edge XMCD spectra in the energy window delimited by the vertical dotted lines. The theoretical spectrum of magnetite has been superimposed for comparison. (c) Schematic depiction of the incorporation of Co2+ ions into the magnetosome structure for MSGM + W.

