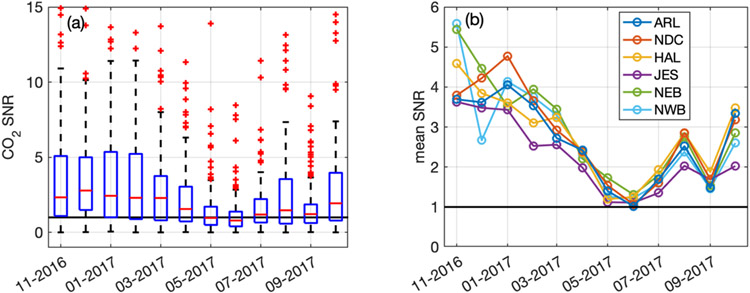
Figure 10.
(a) Monthly box plot of the hourly signal to noise ratio (SNR) at all sites (afternoon hours only), calculated as the CO2 enhancement (yenh) above the background divided by the standard deviation of the backgrounds (Figure 8) for each hour. Red lines are medians; box edges indicate 25th and 75th percentiles; whiskers indicate the extent excluding outliers, which are shown in red + marks. The y-axis has been truncated for readability so some outliers, up to 30, are not shown. (b) Average SNR by month for each site. Black solid line in both panels indicates SNR=1.

