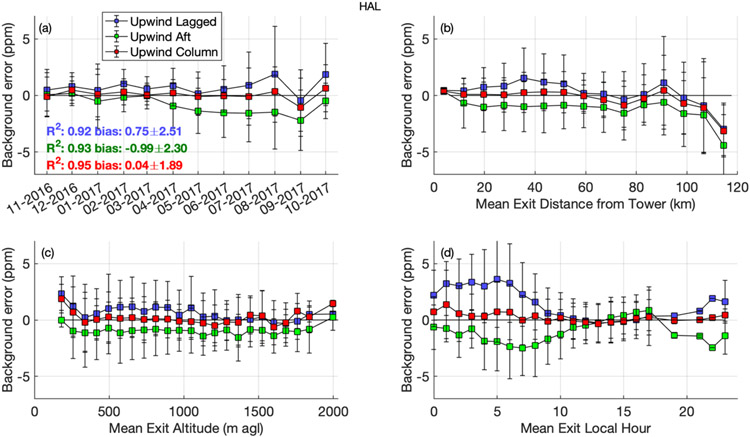
Figure 4.
Results of the synthetic data study. Error in background (constructed background – true background) at HAL (afternoon hours only) for each method of using upwind site observations described in the text. Results for the other urban towers are similar. Red points indicate the column-based background (Upwind Col); green from sampling upwind sites at the same time as urban sites (Upwind Aft); blue from sampling upwind sites at the time of the particle exit (air mass entrance) earlier in the day (Upwind Lagged). Text in panel (a) indicates the coefficient of determination (R2) and mean bias ± one standard deviation of the error over the entire year for each method in the corresponding colors. Panel (a) monthly mean, (b) binned by mean particle exit distance from the closest upwind tower, (c) binned by mean exit altitude, (d) binned by mean exit time of day. Error bars are standard deviations.

