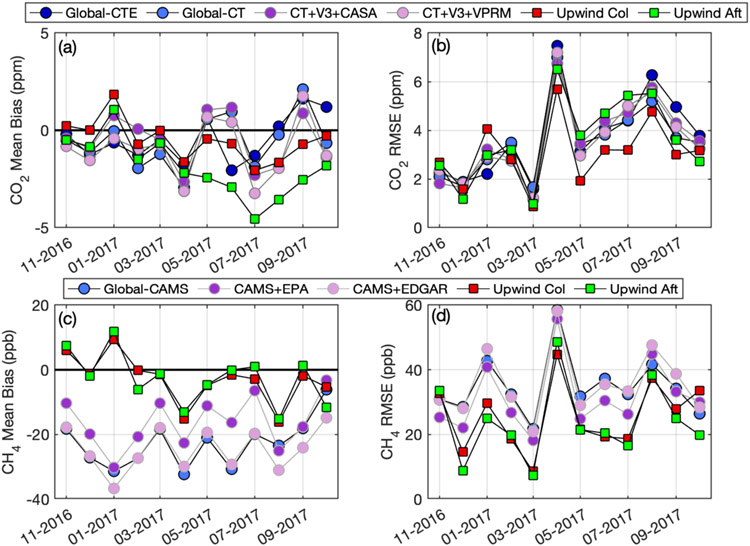
Figure 6.
Average monthly bias (Model – Observations) (a, c) and RMSE (b, d) for different backgrounds over all six urban sites during periods of low influence from within the domain of interest. (a, b) are for CO2; (c, d) are for CH4. All models use the same fluxes inside the urban domain; only the background varies, as indicated in the legends above each set of panels, with abbreviations from Table 1.

