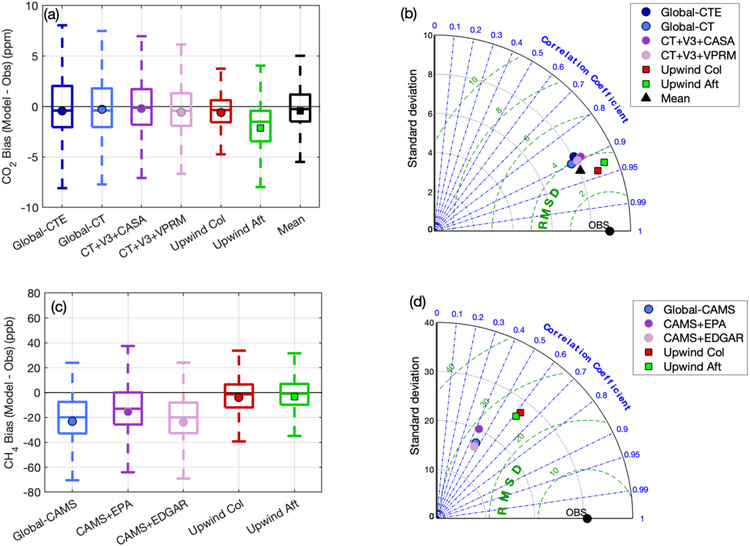
Figure 7.
Annual statistics for modeled vs. observed mole fractions over all six urban sites for CO2 (a, b) and CH4 (c, d) using identical fluxes in the inner domain with the different backgrounds from Table 1. For CO2, we also include the mean of the first five (excluding Upwind Aft). (a, c) Bias (Model – Observations, afternoon hours); center line is the median value of the bias over all low-footprint hours of the year; symbol is the mean; box edges indicate 25th and 75th percentiles (inter-quartile range); whiskers show range excluding outliers; outliers not shown. (b, d) Taylor diagram (Taylor, 2001) illustrating performance replicating the standard deviation of the afternoon observations (black axes at constant radius), correlation (blue angular axes), and root mean square deviation (RMSD, green arcs).

