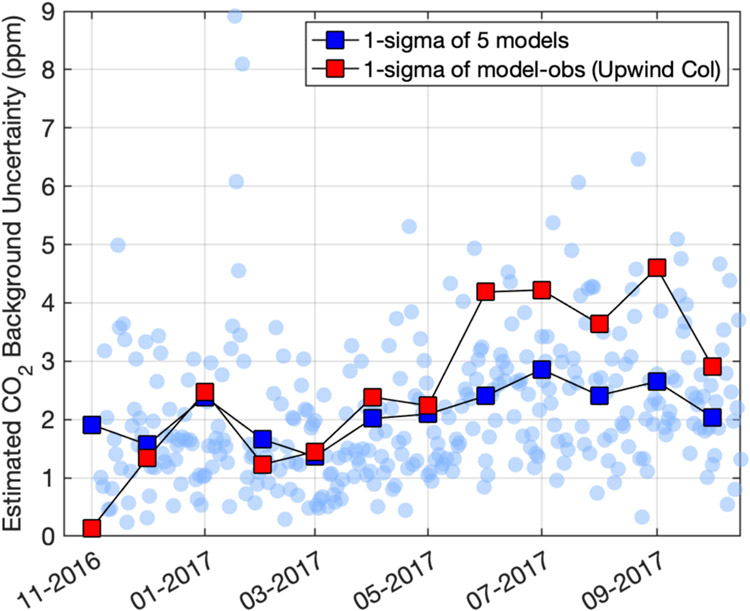
Figure 8.
Comparison of two methods for estimating uncertainty on CO2 background at HAL. The blue squares indicate monthly means of the standard deviation of five different backgrounds (light blue circles are daily). Red points indicate the monthly means of the standard deviation of the difference between modeled and observed mole fractions using the Upwind Column background during low-footprint periods. The other sites show identical patterns and very similar values.

