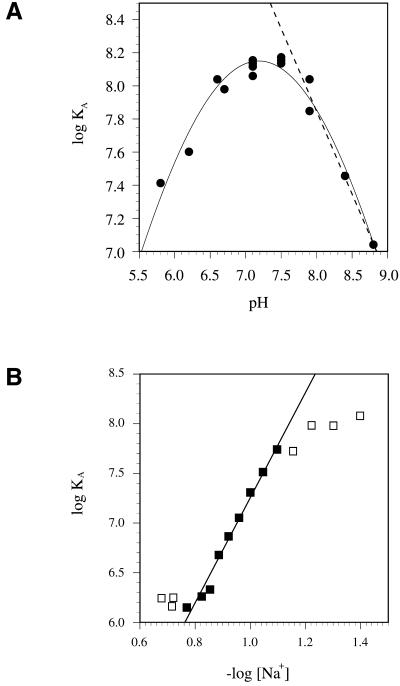
Figure 5.
Electrostatic contributions to the gBP21/gRNA interaction. (A) pH dependence of the binding affinity. The logKA was determined by adsorption filtration and plotted as function of the pH. Linear regression of the data points in the descending region of the curve according to deHaseth et al. (40) allows the conclusion that one to two proton titratable ionic bonds are involved in the gBP21/gRNA interaction. (B) Dependence of the binding affinity on the monovalent ion concentration. The logKA was determined by adsorption filtration and plotted as function of –log[Na+]. A linear least square fit of the data points between 70 and 150 mM [Na+] has a slope (δlogKA/δ – log[Na+]) of 5.8. Using the semi-empirical equation of Record et al. (28), involvement of up to six ionic bonds in the interaction is suggested.

