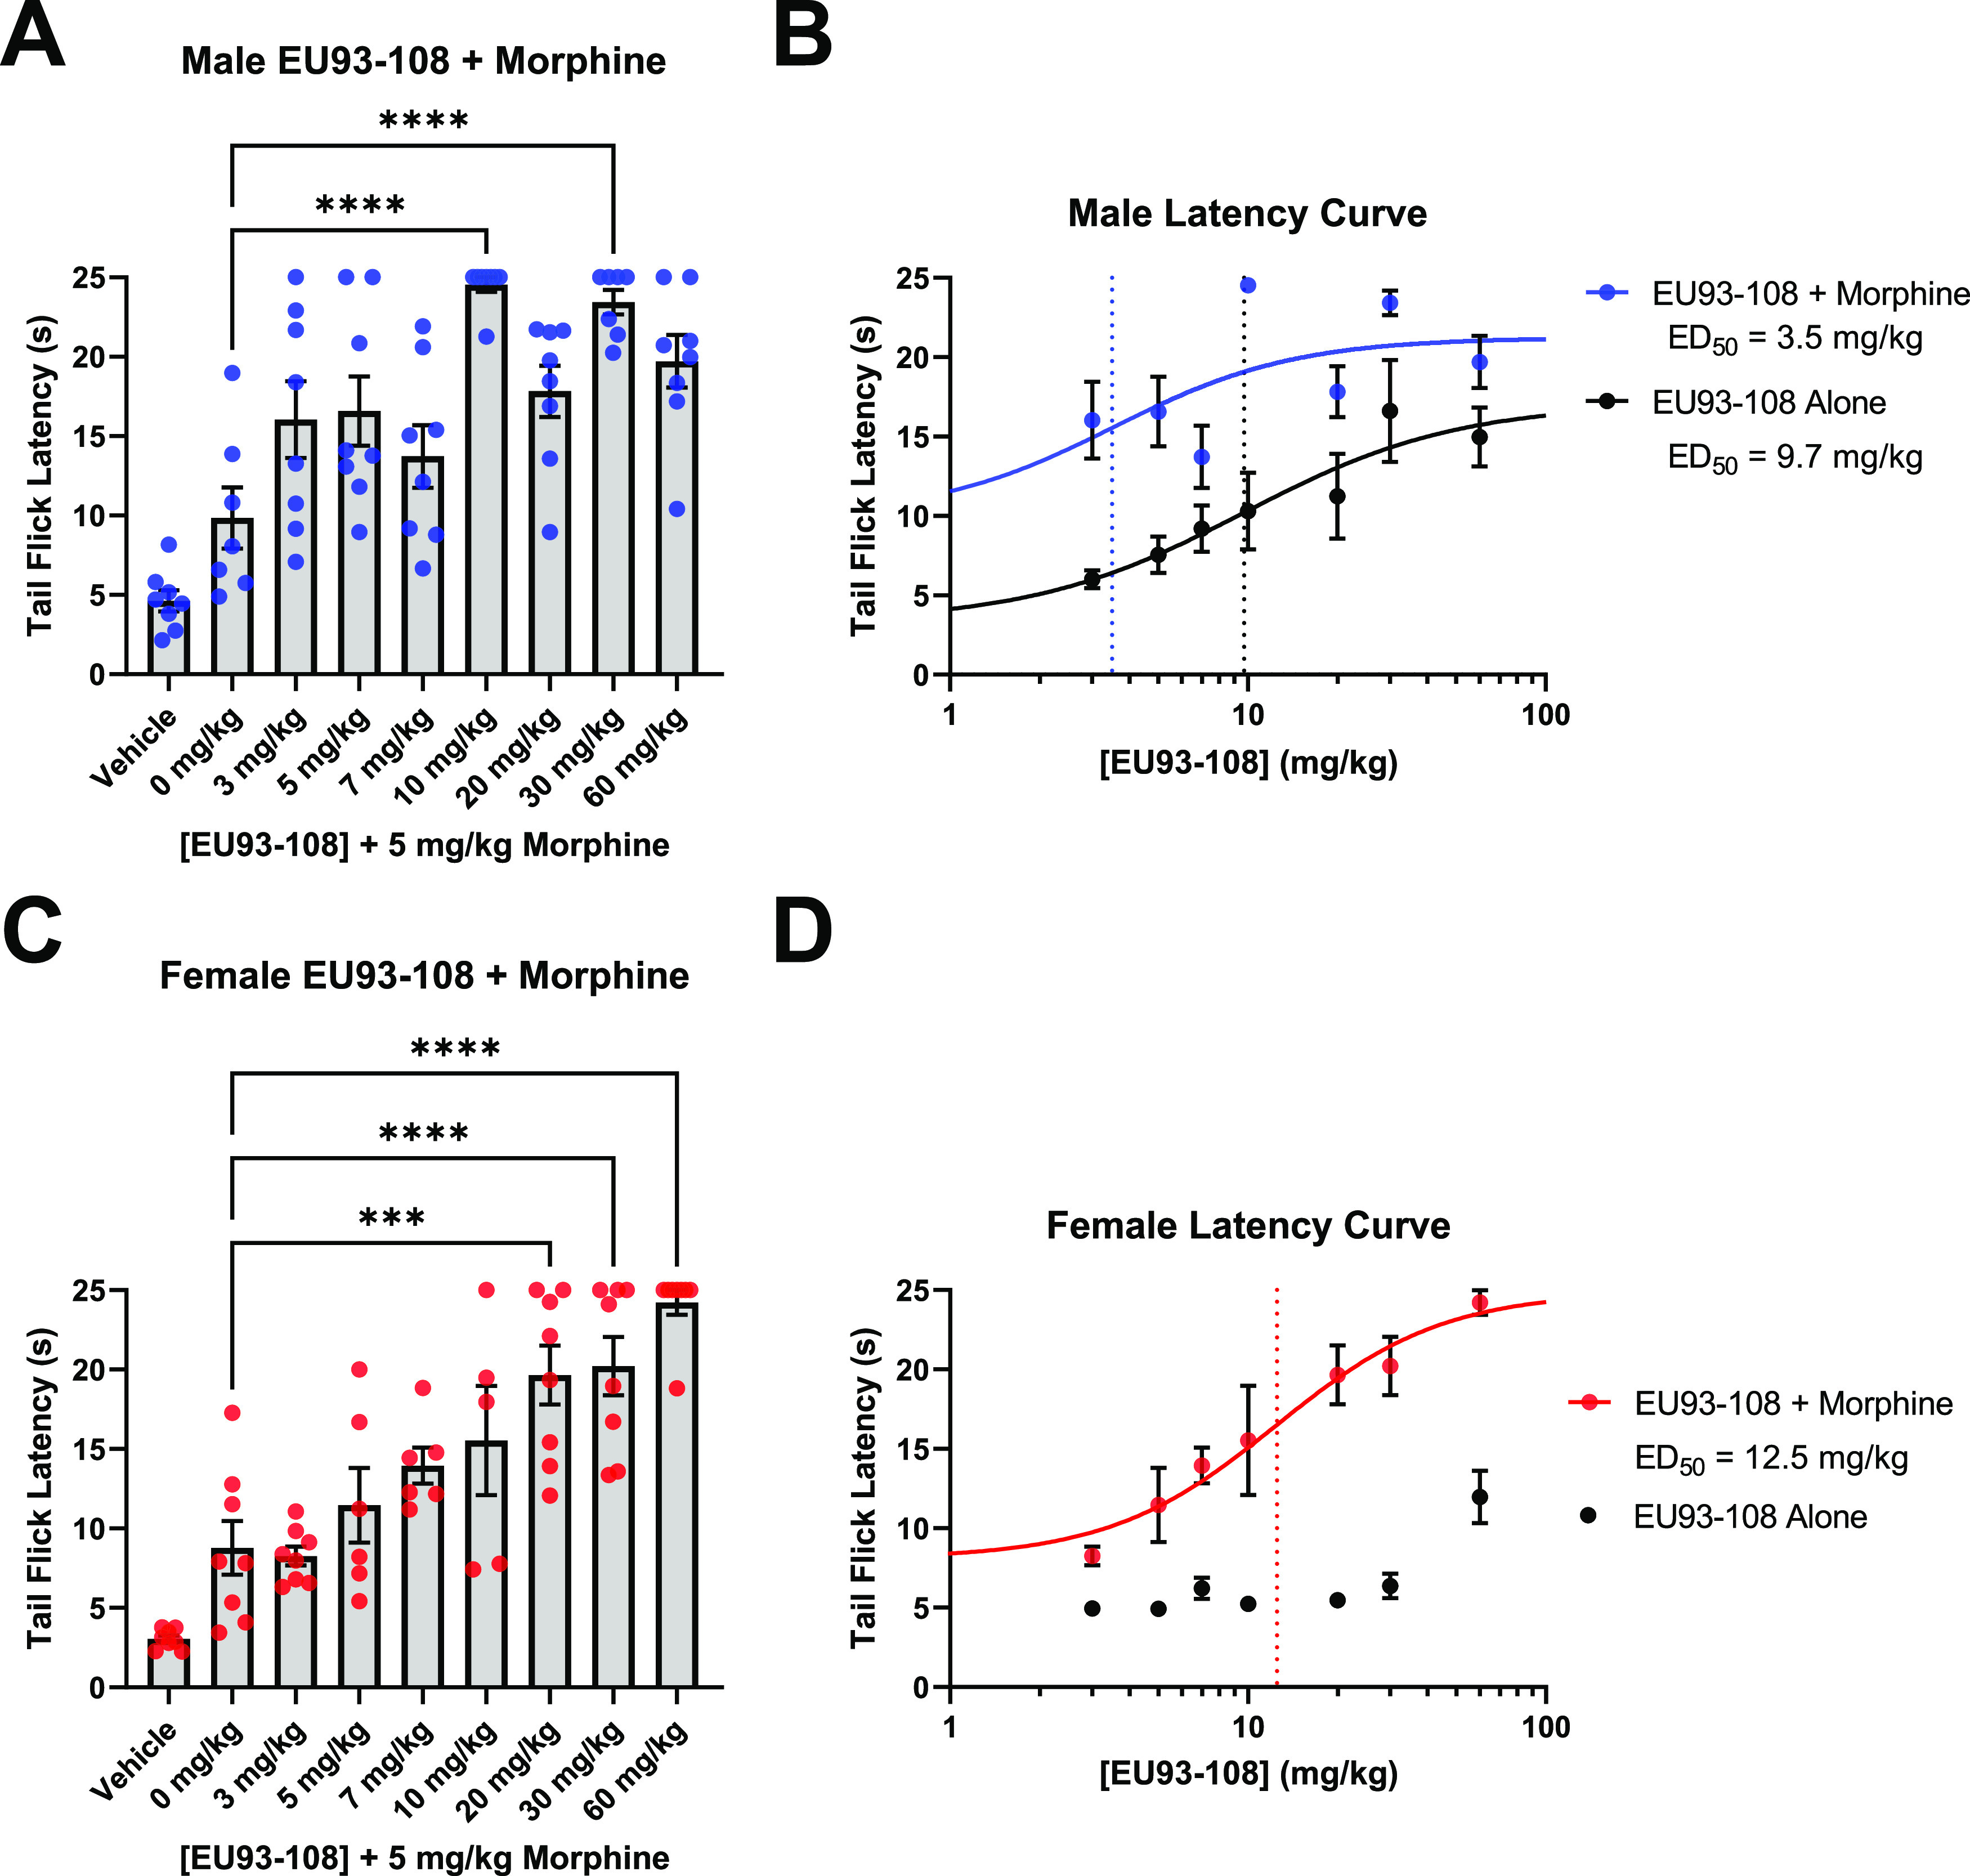
Figure 7.

(A, C) Acute co-administration of EU93-108 and 5 mg/kg morphine in male (A, blue circles) and female (C, red circles) mice. Each dot in (A) and (C) represents one mouse (n = 8 per group). Data were analyzed using one-way ANOVA and Tukey’s post hoc test for multiple comparisons, where all groups were compared to each other. (B, D) Fitted dose–response curves for EU93-108 in male (B) and female (D) mice. The dotted lines depict estimated ED50 values. All data are presented as mean ± SEM.
