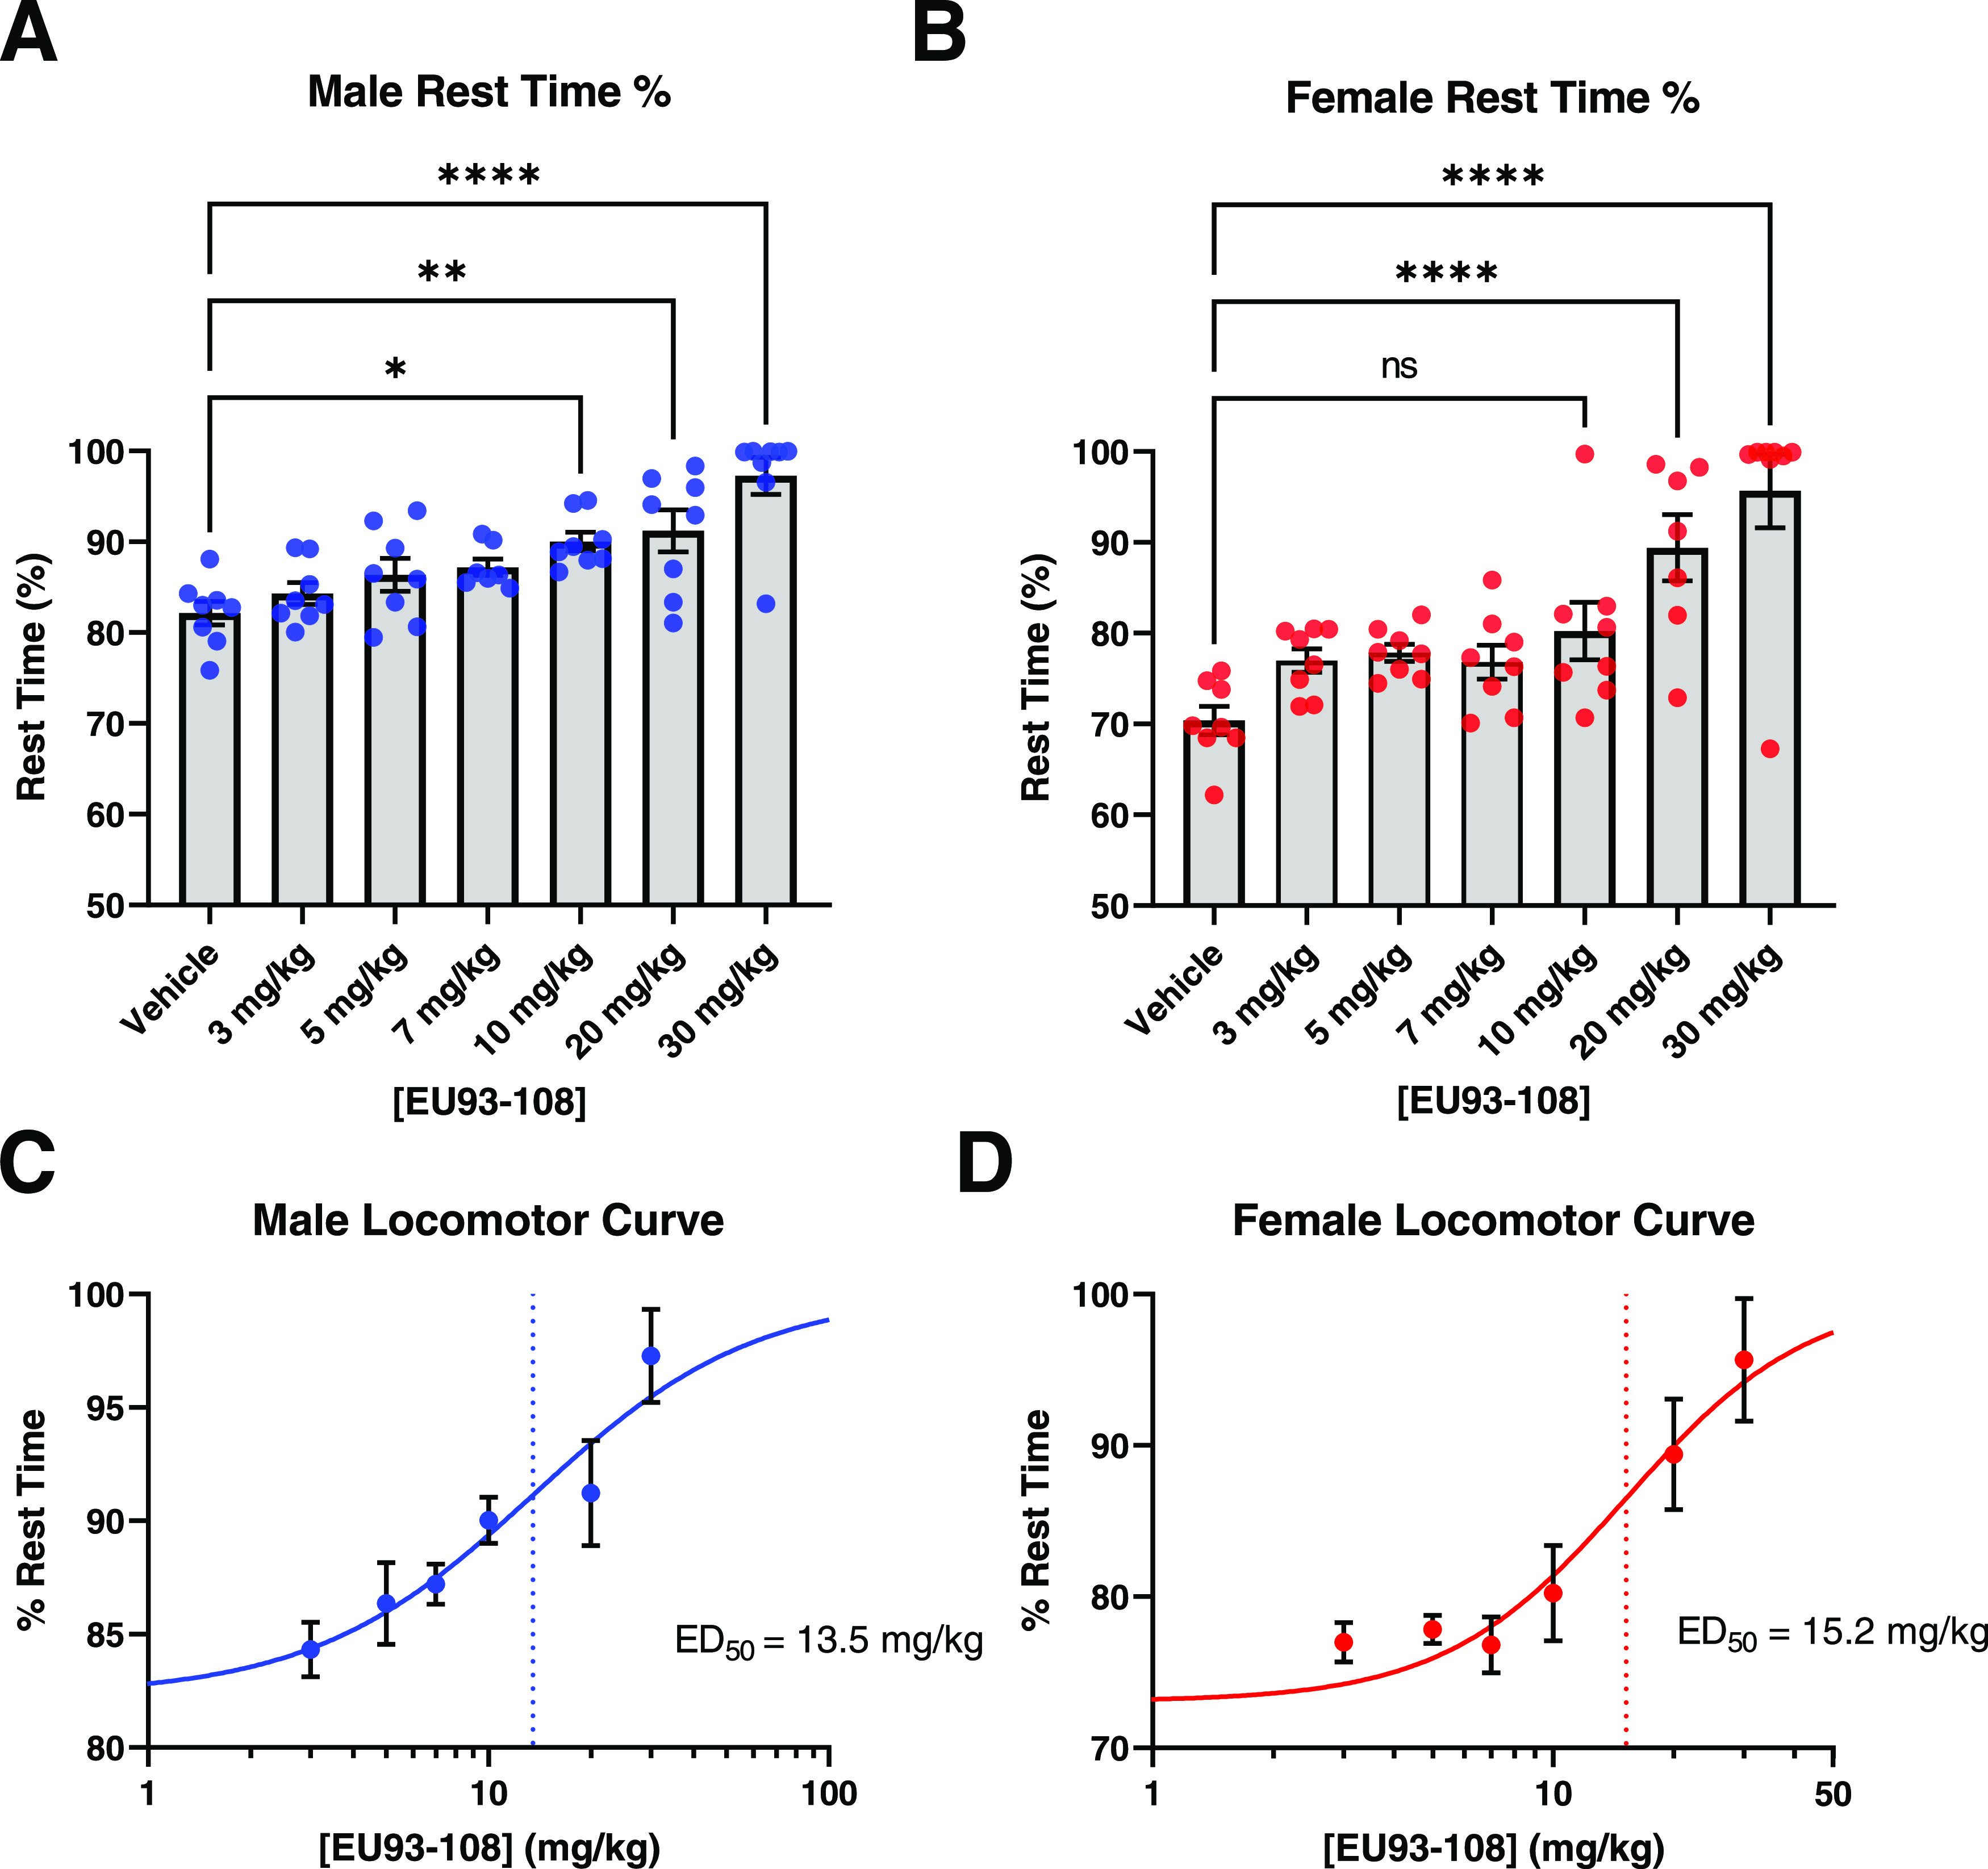
Figure 8.

Rest time data for EU93-108 in male (A, blue circles) and female (B, red circles) mice. Rest time percentage was used to calculate dose–response curves for males and females ((C) and (D), respectively). Each circle in (A) and (B) represents one mouse (n = 8 per group), while each circle in (C) and (D) represents the mean ± SEM of all 8 mice for each group. The dotted lines depict estimated ED50 values. Data were analyzed using one-way ANOVA and Dunnet’s post hoc test for multiple comparisons, where each group was compared to vehicle.
