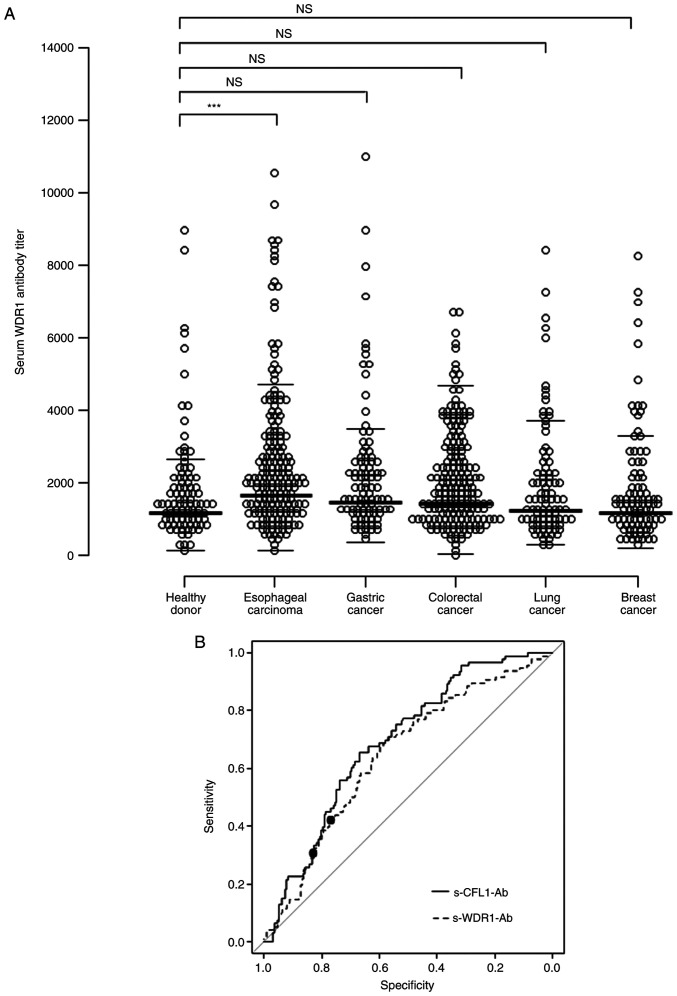
Figure 1.
(A) Comparison of s-WDR1-Ab levels between healthy donors and patients with esophageal, gastric, colorectal, lung, and breast cancers examined using an amplified luminescence proximity homogeneous assay-linked immunosorbent assay (AlphaLISA). The s-WDR1-Ab levels are shown in a scatter dot plot. ***P<0.001; NS, not significant. (B) s-WDR1-Ab and s-CFL1-Ab levels using the ROC curve analysis between the alive and deceased cases in 192 patients with esophageal carcinoma. ROC curves for WDR1-Ab and CFL1-Ab are presented. The area under the ROC curve, 95% confidence interval, cut-off levels, specificity and sensitivity, and P-values are presented in Table SI. Closed circles indicate the positions with the highest sum of sensitivity plus specificity, i.e., the Youden index. The ROC curve analysis was used to calculate the P-values. WDR1, WD repeat-containing protein 1; CFL1, cofilin 1; s-WDR1-Ab, serum anti-WDR1 antibody; s-CFL1-Ab, serum anti-CFL1 antibody; ROC, receiver operating characteristic.

