
FIGURE 3.
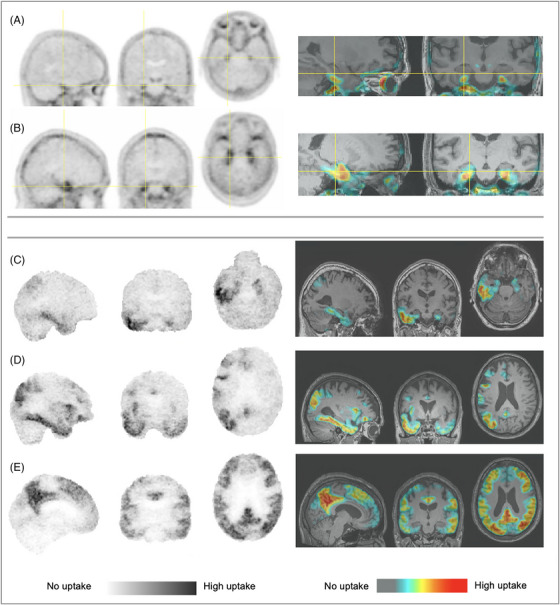
(A,B) “MTL only” with (A) emerging perirhinal/entorhinal signal and (B) spread producing a sagittal “hook” appearance associated with Braak Stage III involvement of entorhinal cortex, hippocampus, and amygdala; (C–E) “MTL AND” with (C) right hemisphere spread into right lateral temporal cortex, (D) asymmetric right hemispheric widespread cortical deposition, and (E) bilateral widespread cortical accumulation. Images also show various display states of smoothed (A,B), unsmoothed (inverted gray C, D, E), inverted gray and color tables, PET‐only and thresholded and superimposed on MRI. Images are from five different participants. Images were contrast adjusted to display range from cerebellar cortex signal to high intensity; the overlay PET images were display thresholded to exclude cerebellar cortex signal levels. MRI, magnetic resonance imaging; PET, positron emission tomography