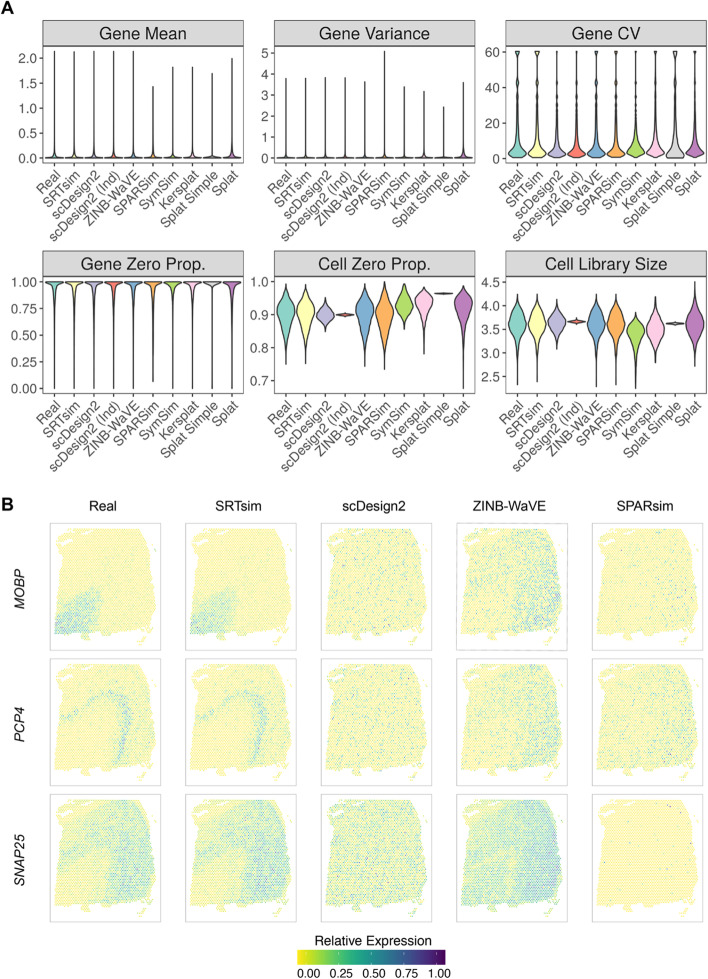
Fig. 2.
Benchmarking SRTsim against eight existing scRNAseq simulators for generating SRT data based on the DLPFC reference data. A Violin plots show the distributions of six metrics (six panels) in the reference data (real; x-axis) and in the synthetic data generated by different simulators (x-axis). The six metrics include four gene-wise metrics (expression mean; variance; coefficient of variation, cv; and zero proportion) and two location-wise metrics (zero proportion and library size). The examined simulators include SRTsim, scDesign2, scDesign2 without copula (scDesign2 (ind)), ZINB-WaVE, SPARSim, SymSim, and three variants of the splatter package (kersplat, splat simple, and splat). Results are shown for the reference sample DLPFC 151673. Results for the other reference samples are provided in the supplemental figures. B The spatial expression patterns of three representative genes (MOBP, PCP4, SNAP25) are displayed in the reference data and in the synthetic data generated by SRTsim, scDesign2, ZINB-WaVE, and SPARSim

