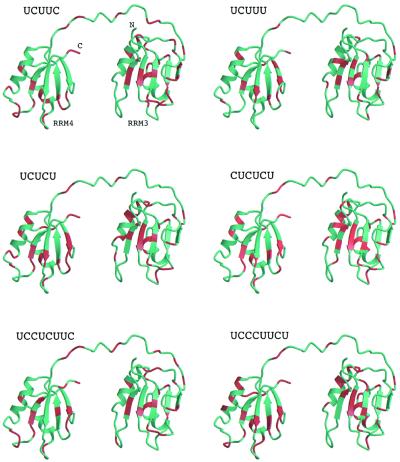
Figure 4.
Structure mapping of the chemical shift patterns obtained with the different RNA oligonucleotides used in this study. The relative disposition shown for RRM3 and RRM4 is arbitrary since the two domains appear to tumble independently in solution. Residues with a combined shift of perturbation of ≥0.1 p.p.m. are shaded red. The figure was prepared using Molscript (49) and Raster3D (50).

