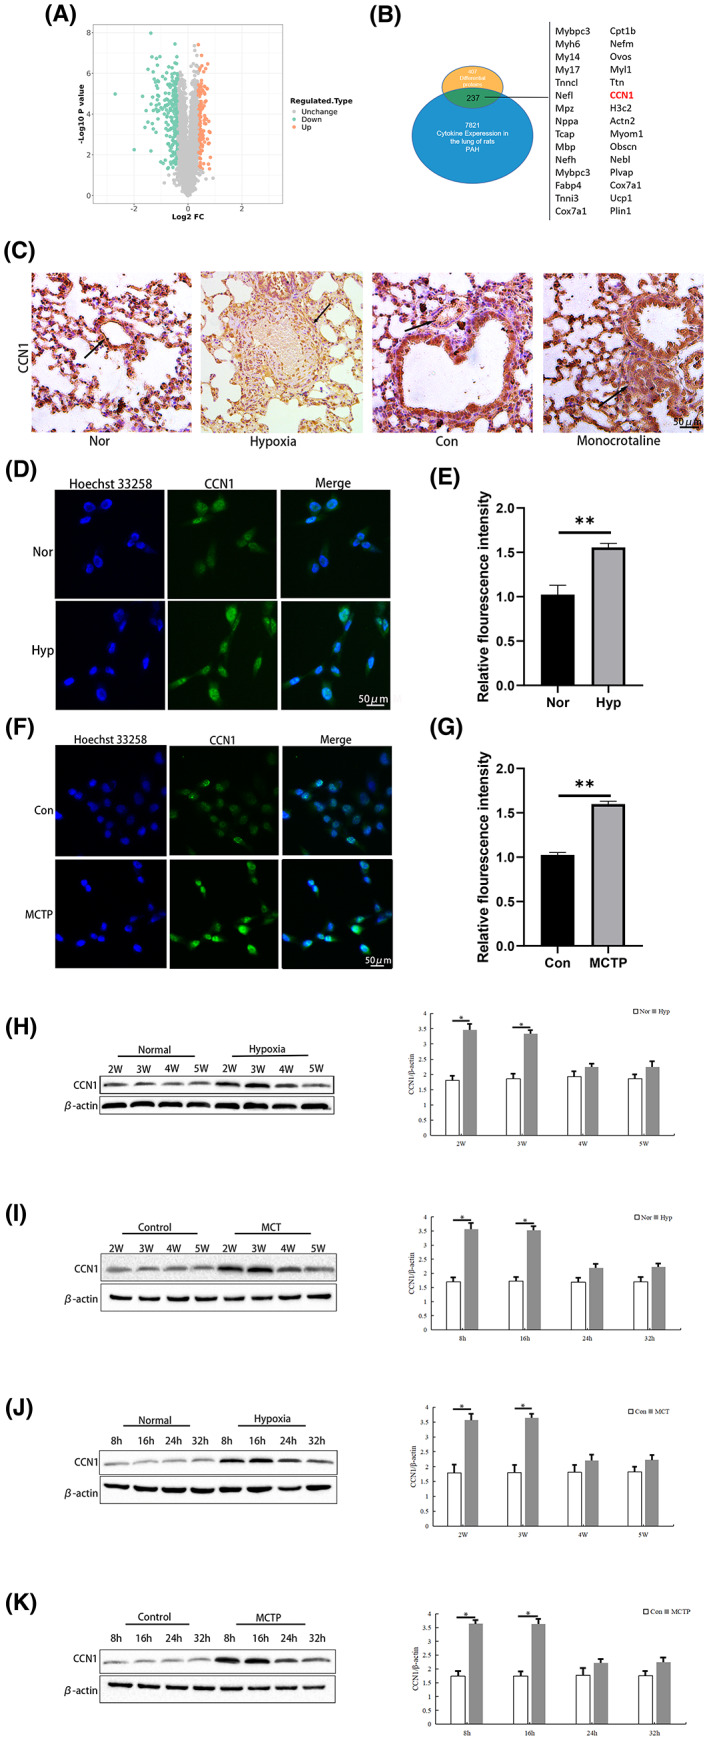
FIGURE 1.

Expression of CCN1 in pulmonary arterial hypertension. (A and B) The proteomic analysis results are shown as volcano plots. (C) The expression of CCN1 in lung tissues of the control group and hypoxia‐ or MCT‐induced group was detected by immunohistochemistry. n = 3. (D–G) The expression of CCN1 in hPAECs of the control group and hypoxia‐ or MCTP‐ induced group was detected by immunofluorescence. n = 3. (H–K) Western blot was used to detect the expression of CCN1 protein in lung tissue and hPAECs under control conditions and induced by hypoxia, MCT or MCTP. n = 3. The data are expressed as the means ± SEM. **p < 0.01 versus the Con/Nor group, *p < 0.05 versus the Con/Nor group.
