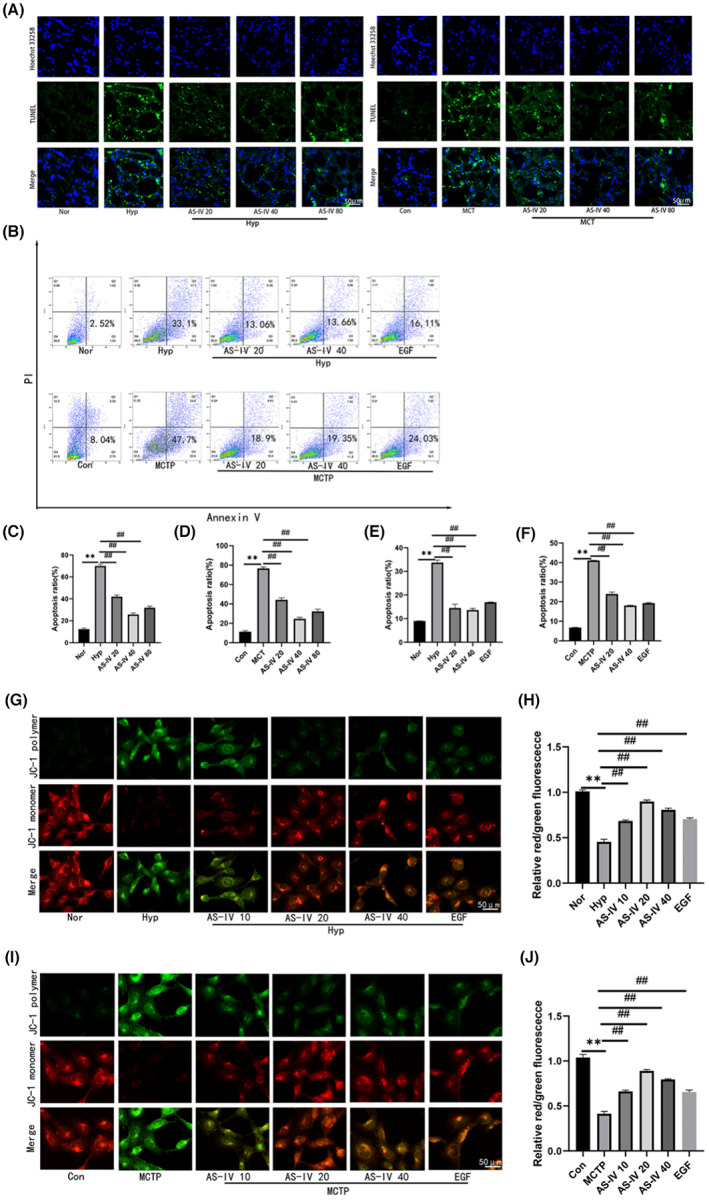
FIGURE 4.

AS‐IV inhibited cell apoptosis. (A,C,D) Apoptosis was detected by TUNEL fluorescence staining. (B,E,F) The apoptosis level of hPAECs cells was detected by Annexin‐V/PI staining and flow cytometry. The upper and lower right regions were regarded as apoptotic regions. (G–J) HPAECs cells were stained with JC‐1, and the mitochondrial membrane potential was evaluated by fluorescence microscopy. The data are expressed as the means ± SEM, n = 3. **p < 0.01 versus the Con/Nor group. # p < 0.05, ## p < 0.01 versus the Hyp/MCT/MCTP group.
