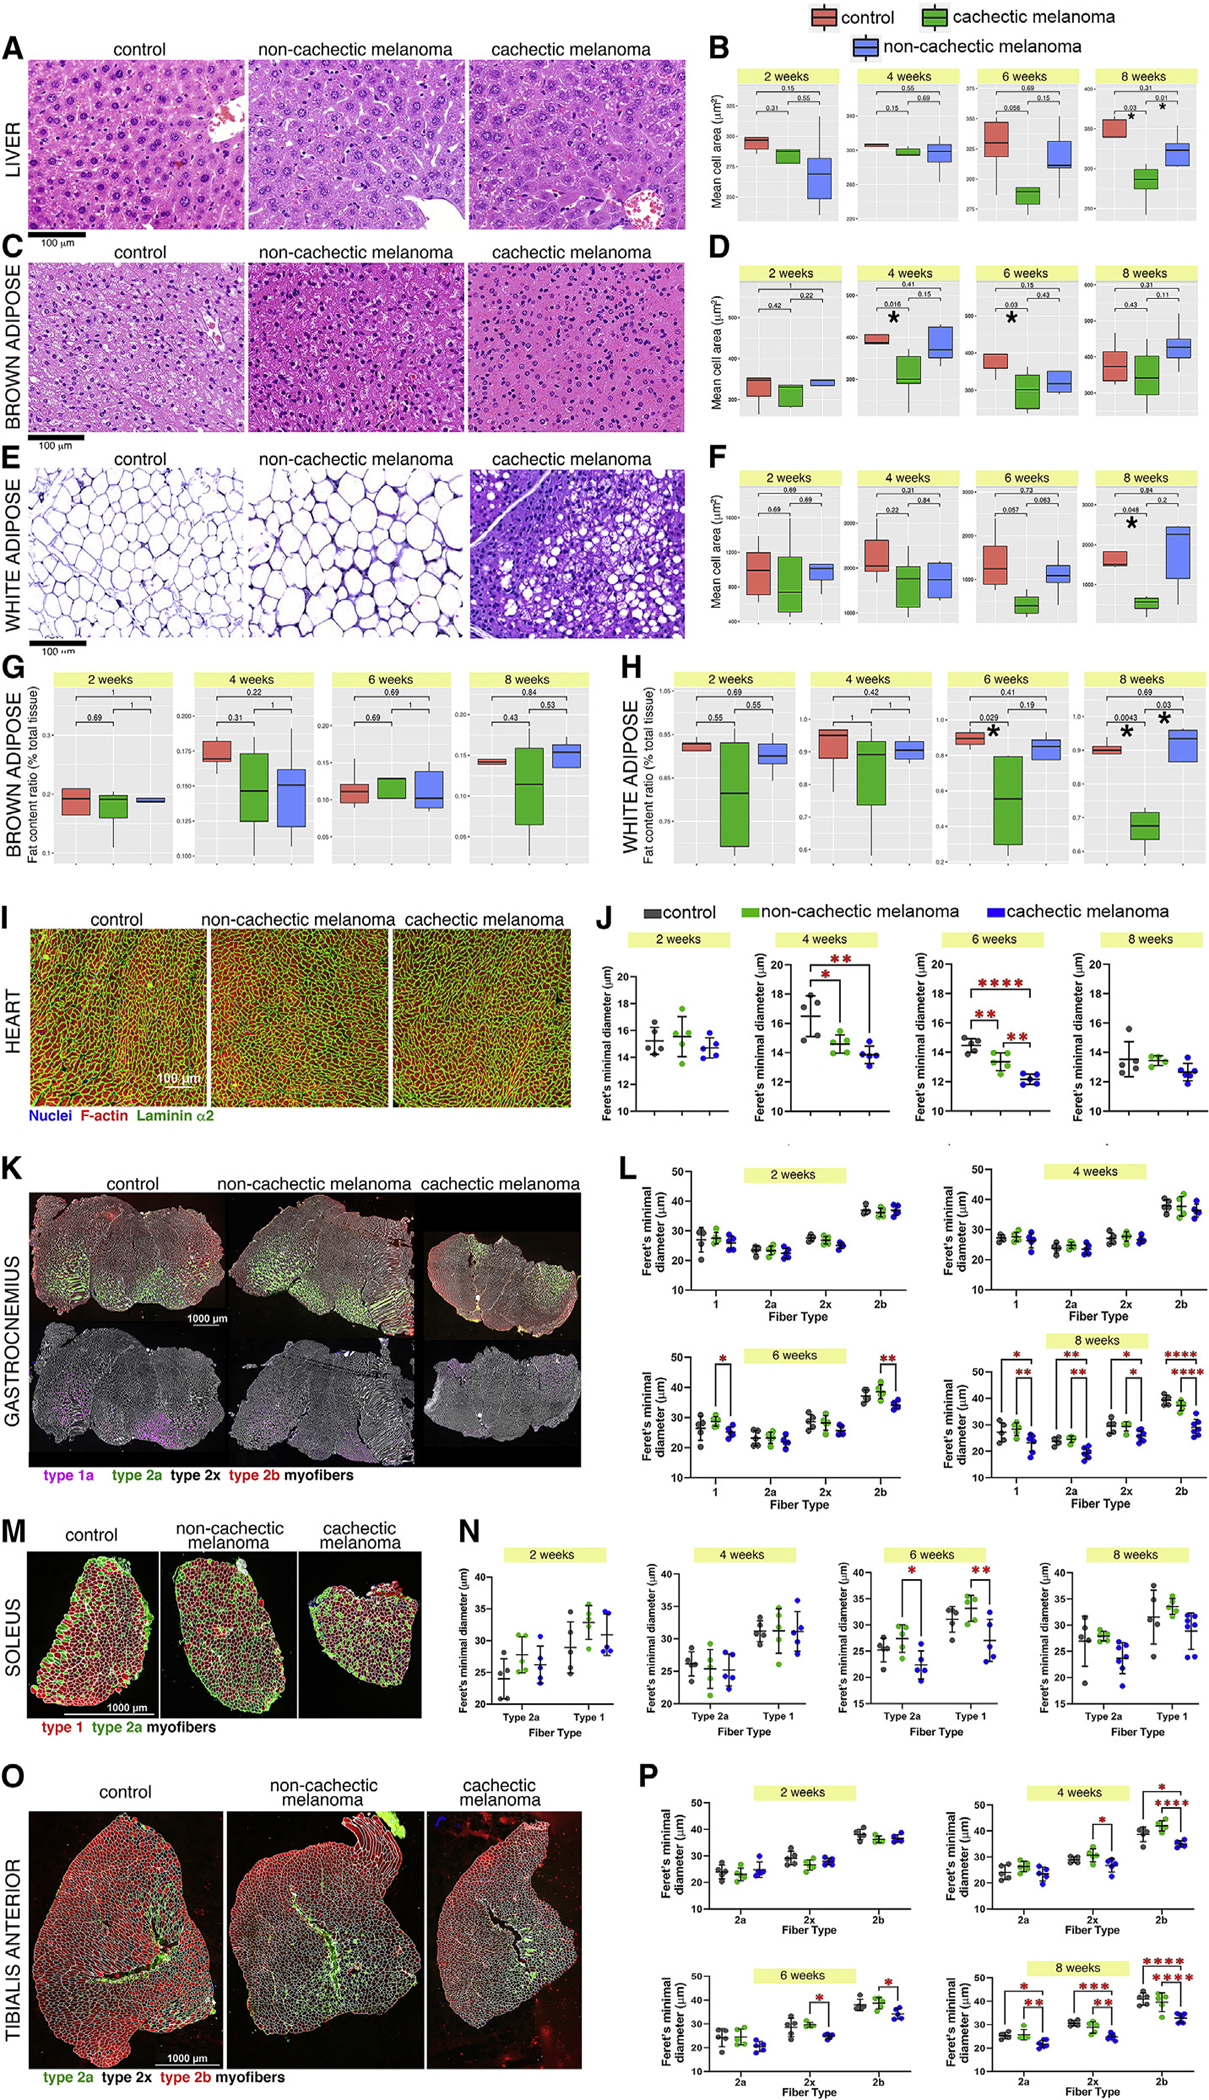
Figure 3. Different degrees of cancer-induced cell atrophy in distinct tissues.

(A) H&E staining of liver sections after 8 weeks from melanoma injection. Scale bar, 100 μm.
(B) Cachexia reduces hepatocyte size at 6 and 8 weeks. Control values are shown in red, whereas cachectic and non-cachectic values are shown in green and blue, respectively. *p < 0.05.
(C–F) Cachexia leads to cell atrophy at 4 and 6 weeks (brown adipocytes; C and D) and at 8 weeks (white adipocytes; E and F).
(G and H) There is also a trend toward decreased fat content of brown adipocytes (G), and such delipidation is significant for white adipocytes (H).
(I) Analysis of cardiomyocyte size at 8 weeks after melanoma injection; nuclei are shown in blue, F-actin in red, and laminin α2 in green. Scale bar, 100 μm.
(J) For each time point, the Feret’s minimal diameter provides an estimate of the average cell size. There are no substantial changes at 2 weeks, whereas cardiomyocyte size is significantly reduced at 4–6 weeks.
(K) Myofiber size in the gastrocnemius at 8 weeks after tumor implantation. Scale bar, 1000 μm.
(L) Atrophy of type 1 and 2b myofibers occurs significantly at 6 weeks, whereas general decline in myofiber size is found at week 8.
(M and N) The soleus muscle is relatively resistant to wasting, and a significant or trending decline in type 1 and 2a myofiber size is found only at 6–8 weeks.
(O and P) On the contrary, atrophy of type 2x and 2b myofibers occurs at 4 and 6 weeks and is further exacerbated by 8 weeks in the tibialis anterior muscle, which is prone to wasting.
In (I)–(P), SD is shown with *p < 0.05, **p < 0.01, ***p < 0.001, and ****p < 0.0001.
