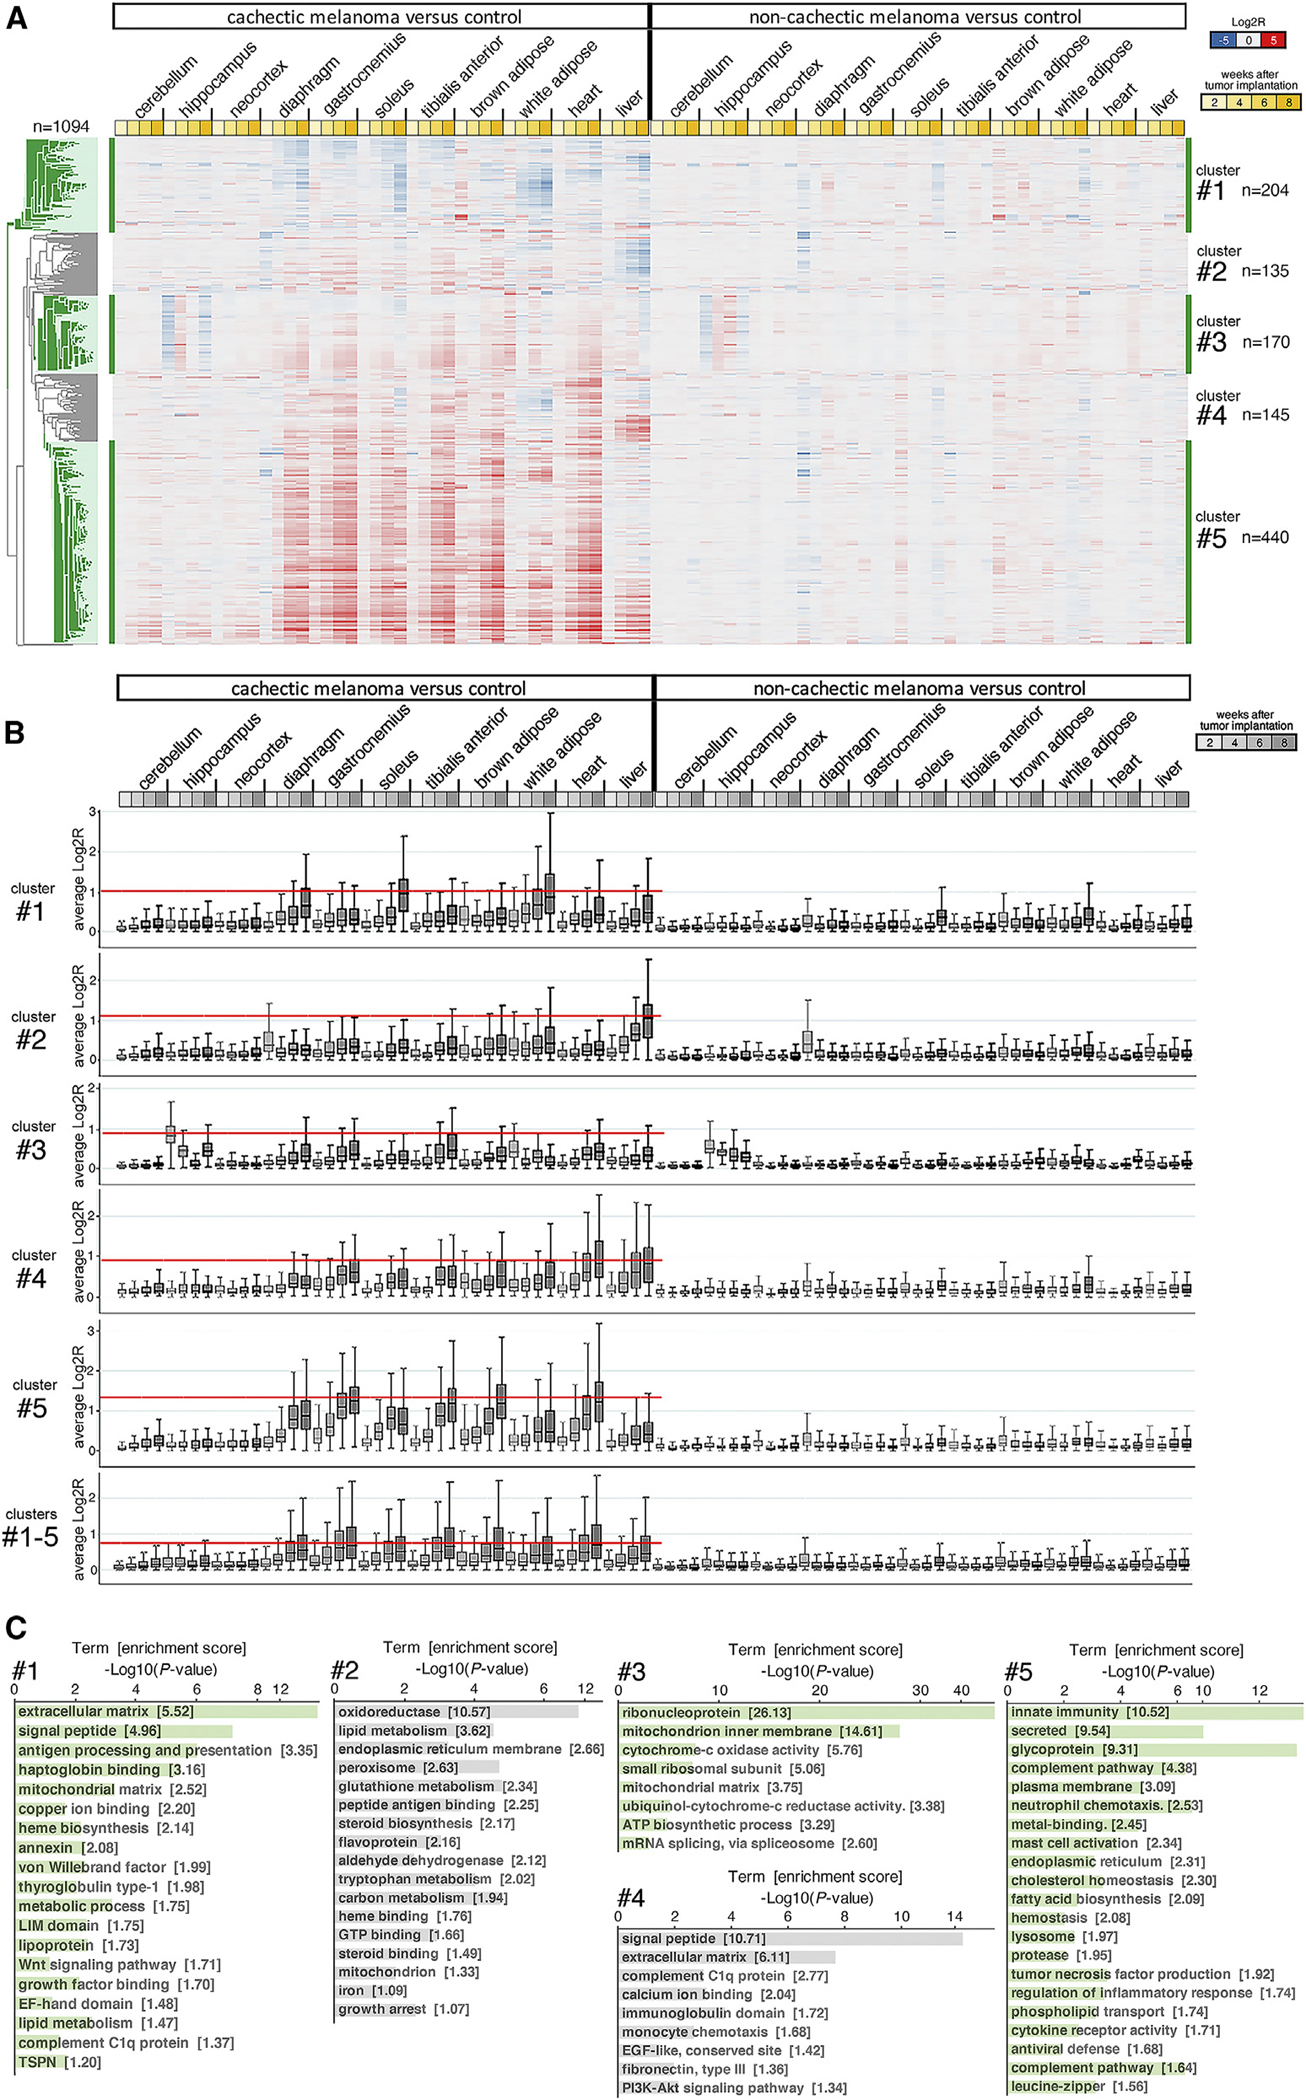
Figure 4. Gradual transcriptional changes define cachexia progression in tissues and organs of mice implanted with cachectic melanoma xenografts.

(A) Heatmap of 1,094 genes (five clusters) that are most highly associated with cachexia development. Most of these genes are upregulated by cachexia, particularly in skeletal muscles and the heart. Downregulation of gene expression occurs primarily in the WAT and liver. Few of these genes are modulated in brain areas (cerebellum, hippocampus, and neocortex). No expression changes occur in the tissues/organs of mice implanted with non-cachectic melanomas, compared with controls. The mean Log2R values are color coded (downregulated genes are shown in blue, upregulated genes in red). Different shades of yellow indicate 2, 4, 6, and 8 weeks after tumor cell injection.
(B) Cumulative gene expression changes induced by cachexia in distinct tissues for each gene cluster, analyzed separately (clusters 1, 2, 3, 4, and 5) and cumulatively (clusters 1–5). The absolute Log2R values are shown. The red line identifies the tissues where cachexia induces the most prominent gene expression changes. The boxes indicate the 25th and 75th percentiles, whereas the whiskers indicate the range.
(C) GO term analyses for gene clusters 1–5 identify different gene categories that are modulated by cachexia.
See also Figures S3–S6.
