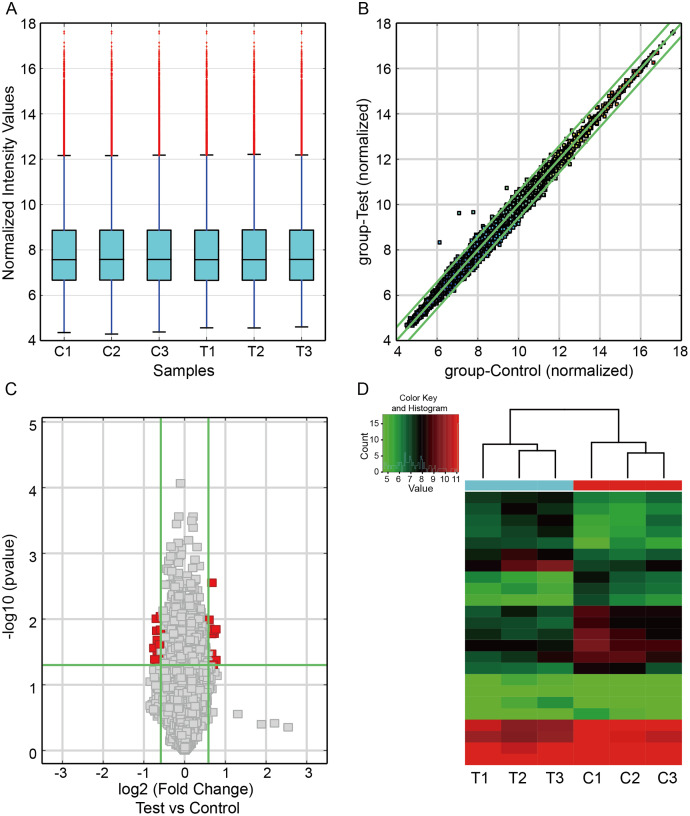
Figure 1. Differentially expressed circRNAs in renal from CIH mice.
(A) The box plot demonstrated the nearly identical distributions of circRNAs in the renal samples of the CIH and Control groups. The red data points are outliers. (B) The scatter plot was used to identify the variation of circRNAs expression between the two groups. The green lines represented 1.5-fold changes. circRNAs beyond the range of green lines indicated >1.5-fold difference between the two compared groups. (C) The volcano plot exhibited significantly aberrant circRNAs in CIH-induced renal injury. The red squares represented the dysregulated circRNAs with significant difference. (D) Hierarchical clustering analysis revealed a distinct circRNA expression pattern between the two groups.

