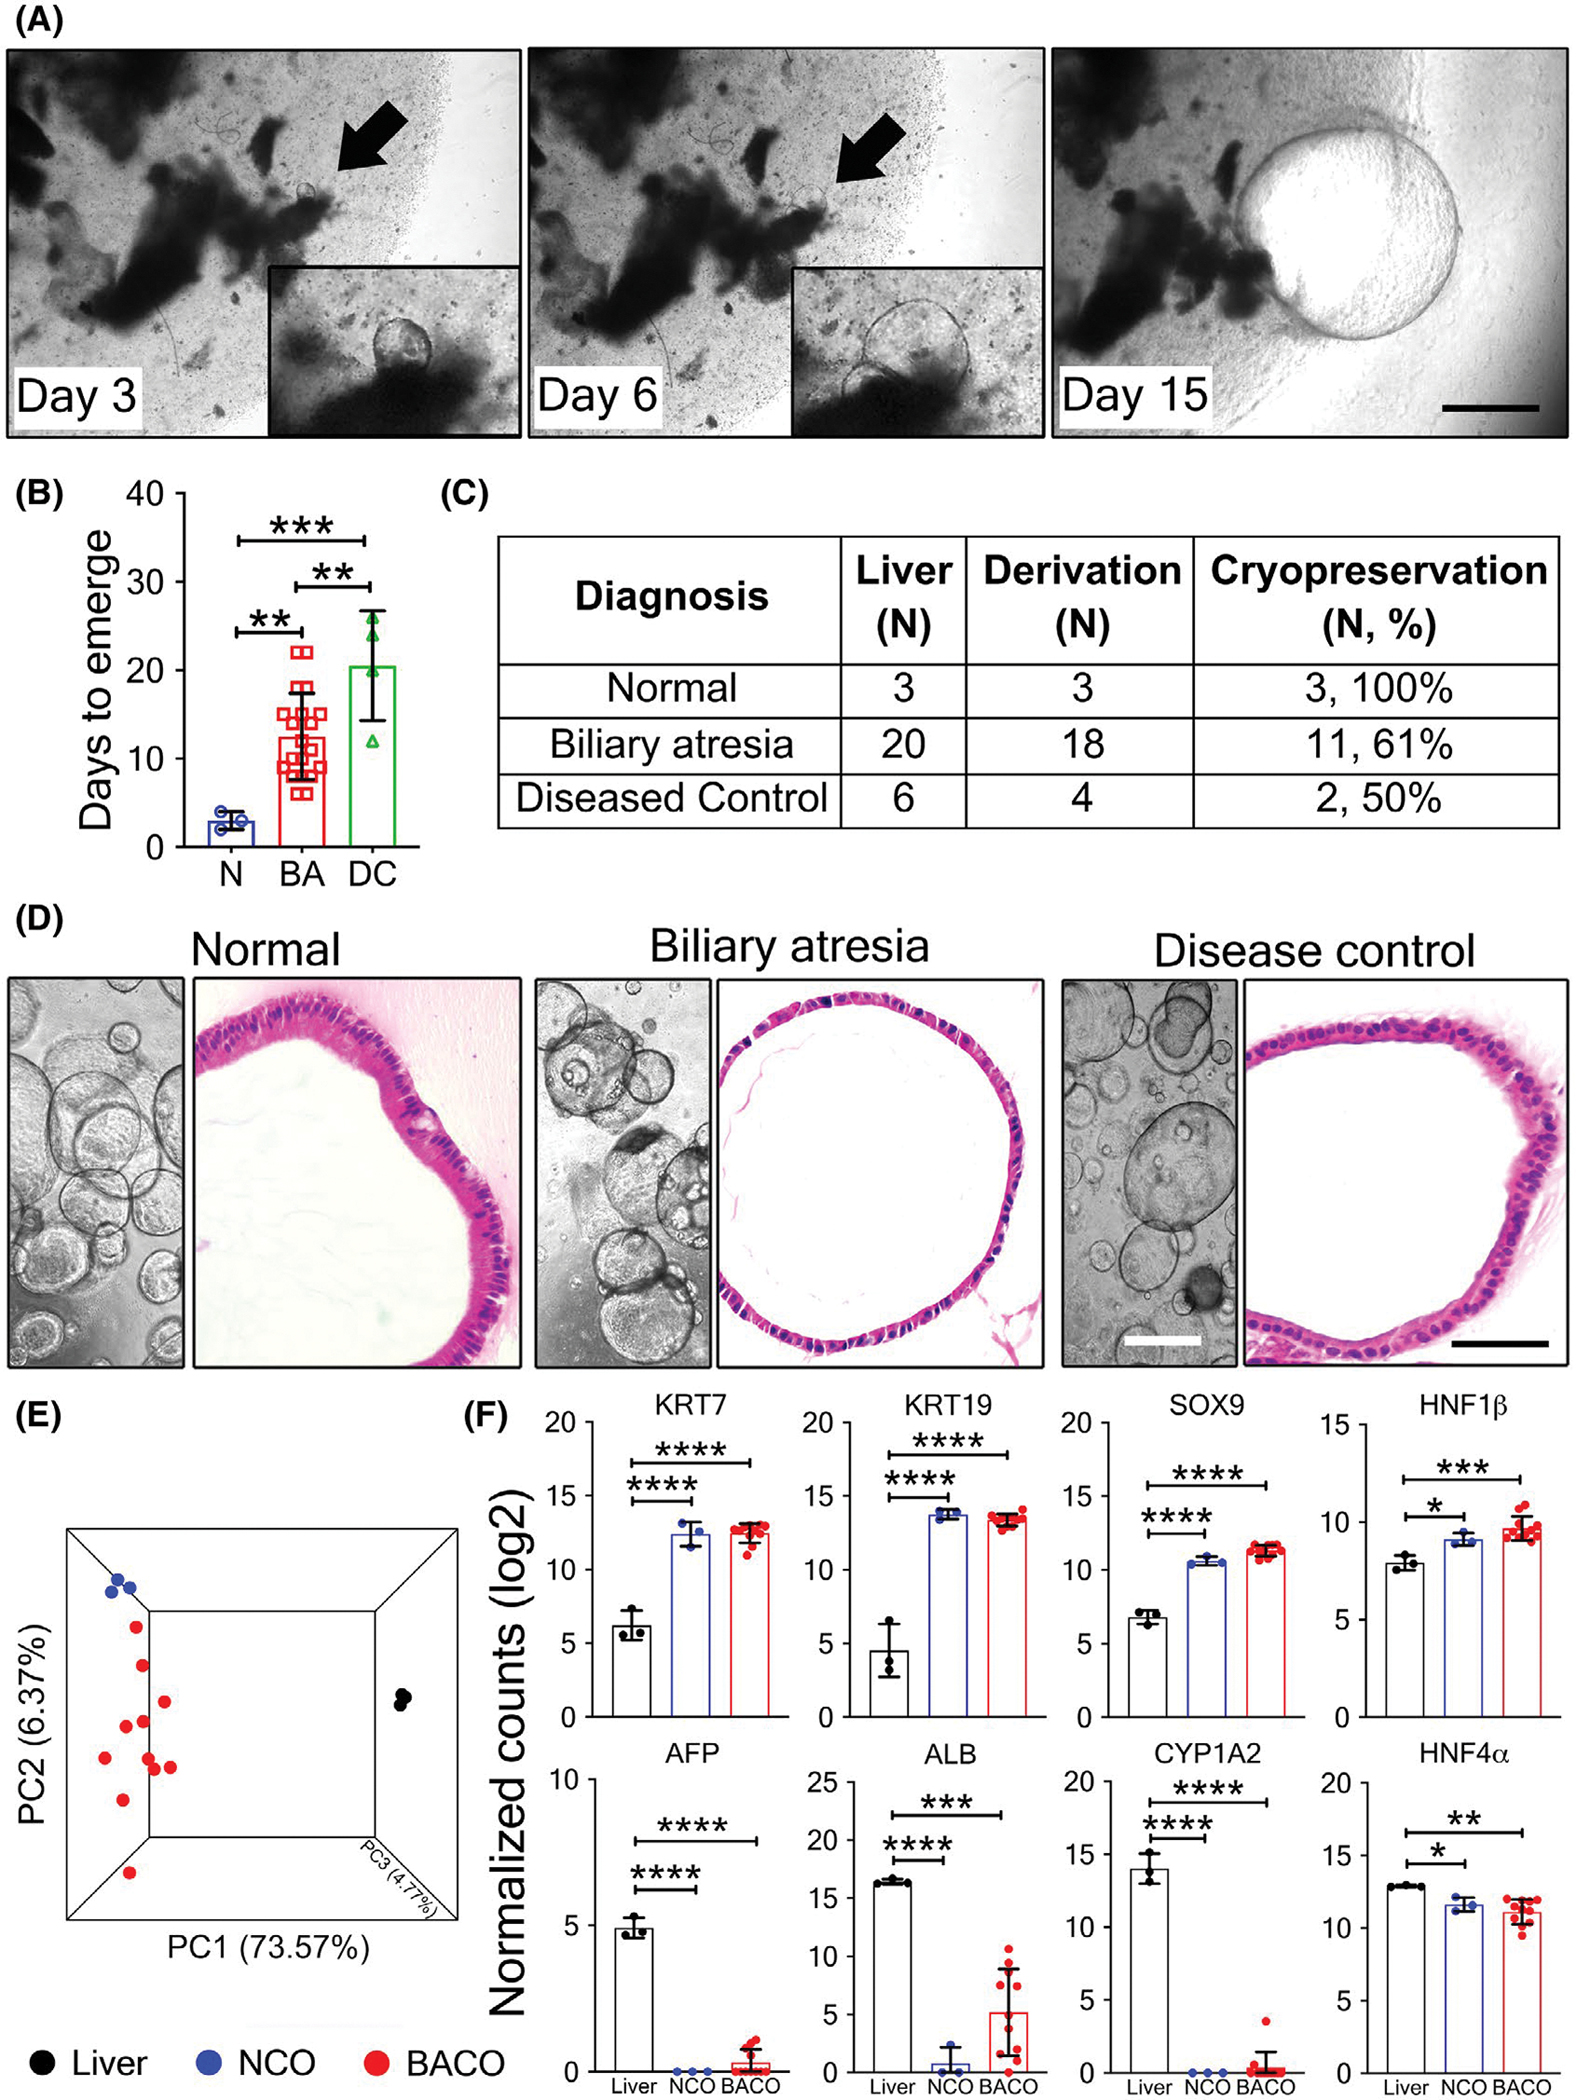
FIGURE 1.

Emergence and growth of biliary organoids from human livers. (A) Phase contrast microscopy show emergence (arrows) of organoids from liver biopsies from healthy subjects at days 3, 6, and 15 of culture; insets show magnified view. (B) Number of days for organoids to emerge. (C) Number of organoids successfully derived, cryopreserved, and passaged. (D) Phase contrast images (left panels; ×10 magnification) depicting organoid growth, and hematoxylin and eosin staining (right panels; ×40 magnification) showing histological features from NCO, BACO, and DCO cholangiocyte-like organoids (scale bar, 50 μm). (E) Three-way PCA analysis of RNA-seq data comparing NCOs (n = 3), BACOs (n = 11), and liver tissues (n = 3). (F) RNA expression levels for cholangiocyte-enriched (top panel) and hepatocyte-enriched (lower panel) genes. Statistical analysis was performed using Mann-Whitney U test; ****p < 0.0001, ***p < 0.001, **p < 0.01, *p < 0.5. AFP, alpha-fetoprotein; ALB, albumin; KRT, keratin; ns, not significant; PC, principal component; SOX9, SRY (sex determining region Y)-box 9
