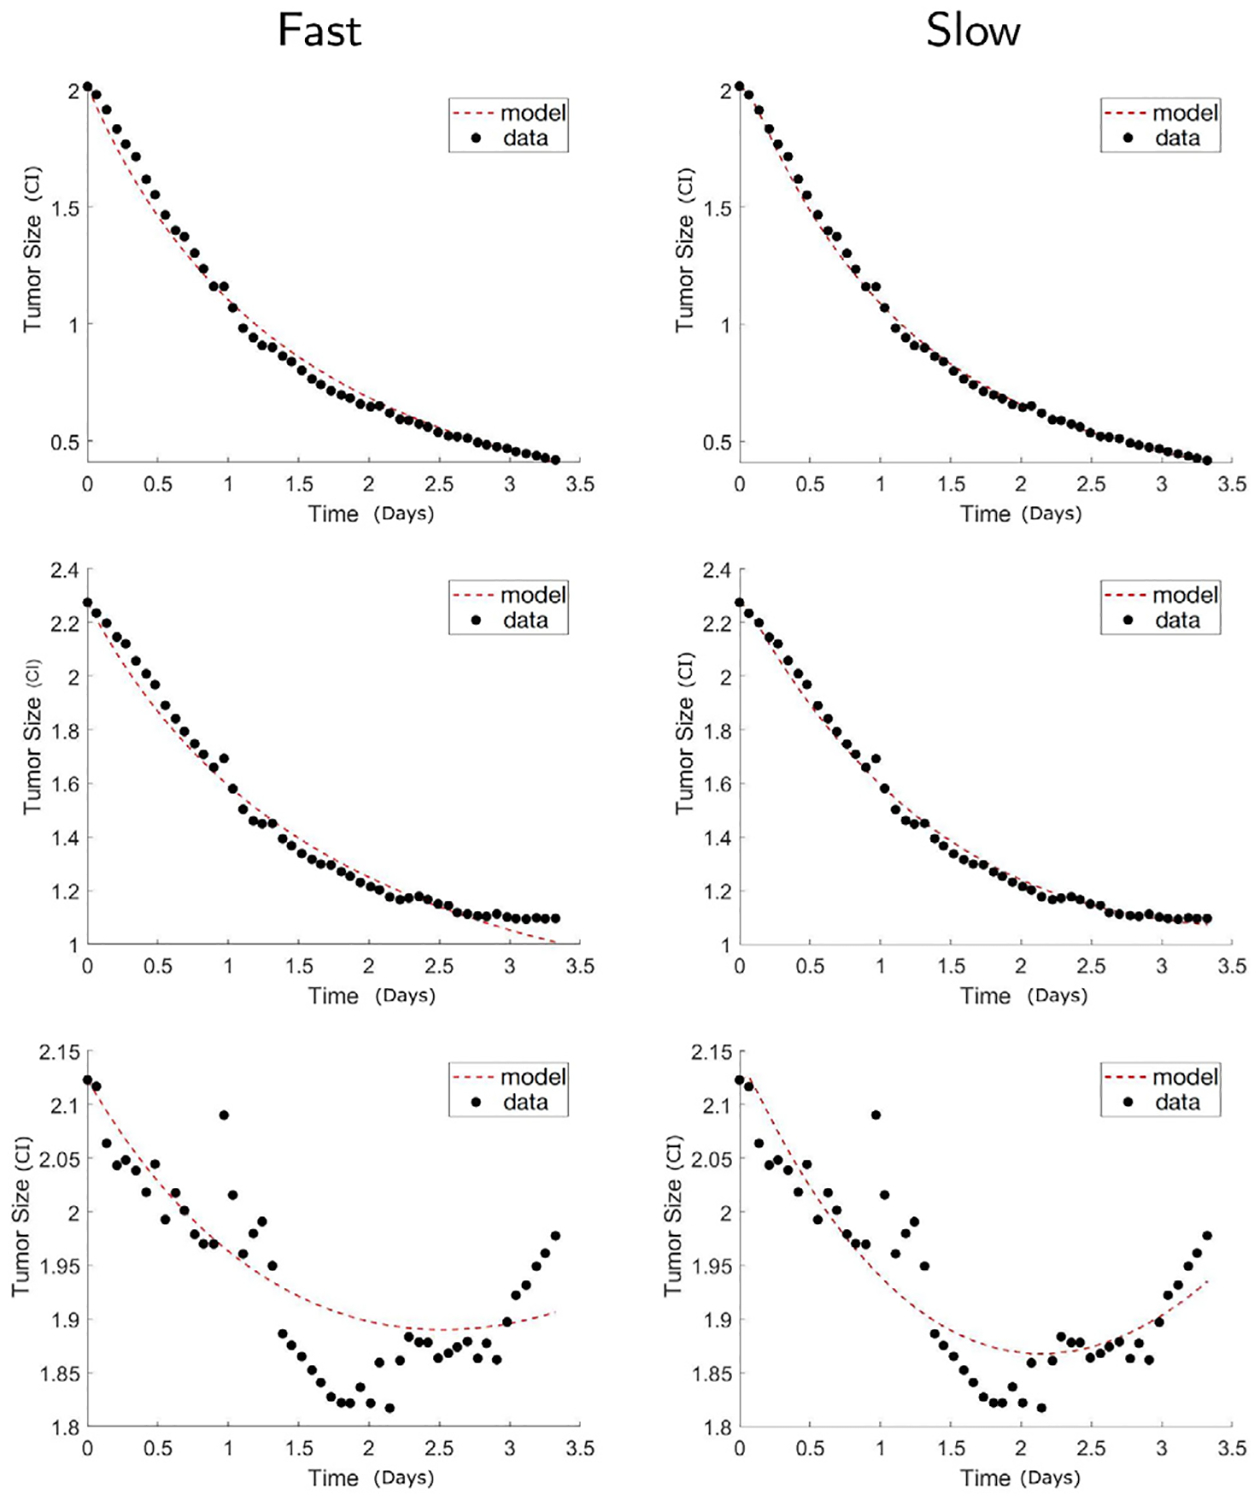
Fig. 3.

Low IL13Rα2 antigen density glioma. Comparison of the calibrated model fits between the fast reaction model Eq. (3) (Fast) and the slow reaction model Eq. (2) (Slow). The shown results are for low receptor density cancer with CAR T-cell to cancer ratio 1:5 (top), 1:10 (middle), and 1:20 (bottom). The calibrated model fits using the slow reaction model are closer to the data points, demonstrating that the slow reaction model more accurately describes the experimental data than the fast reaction model in the case of low receptor density.
