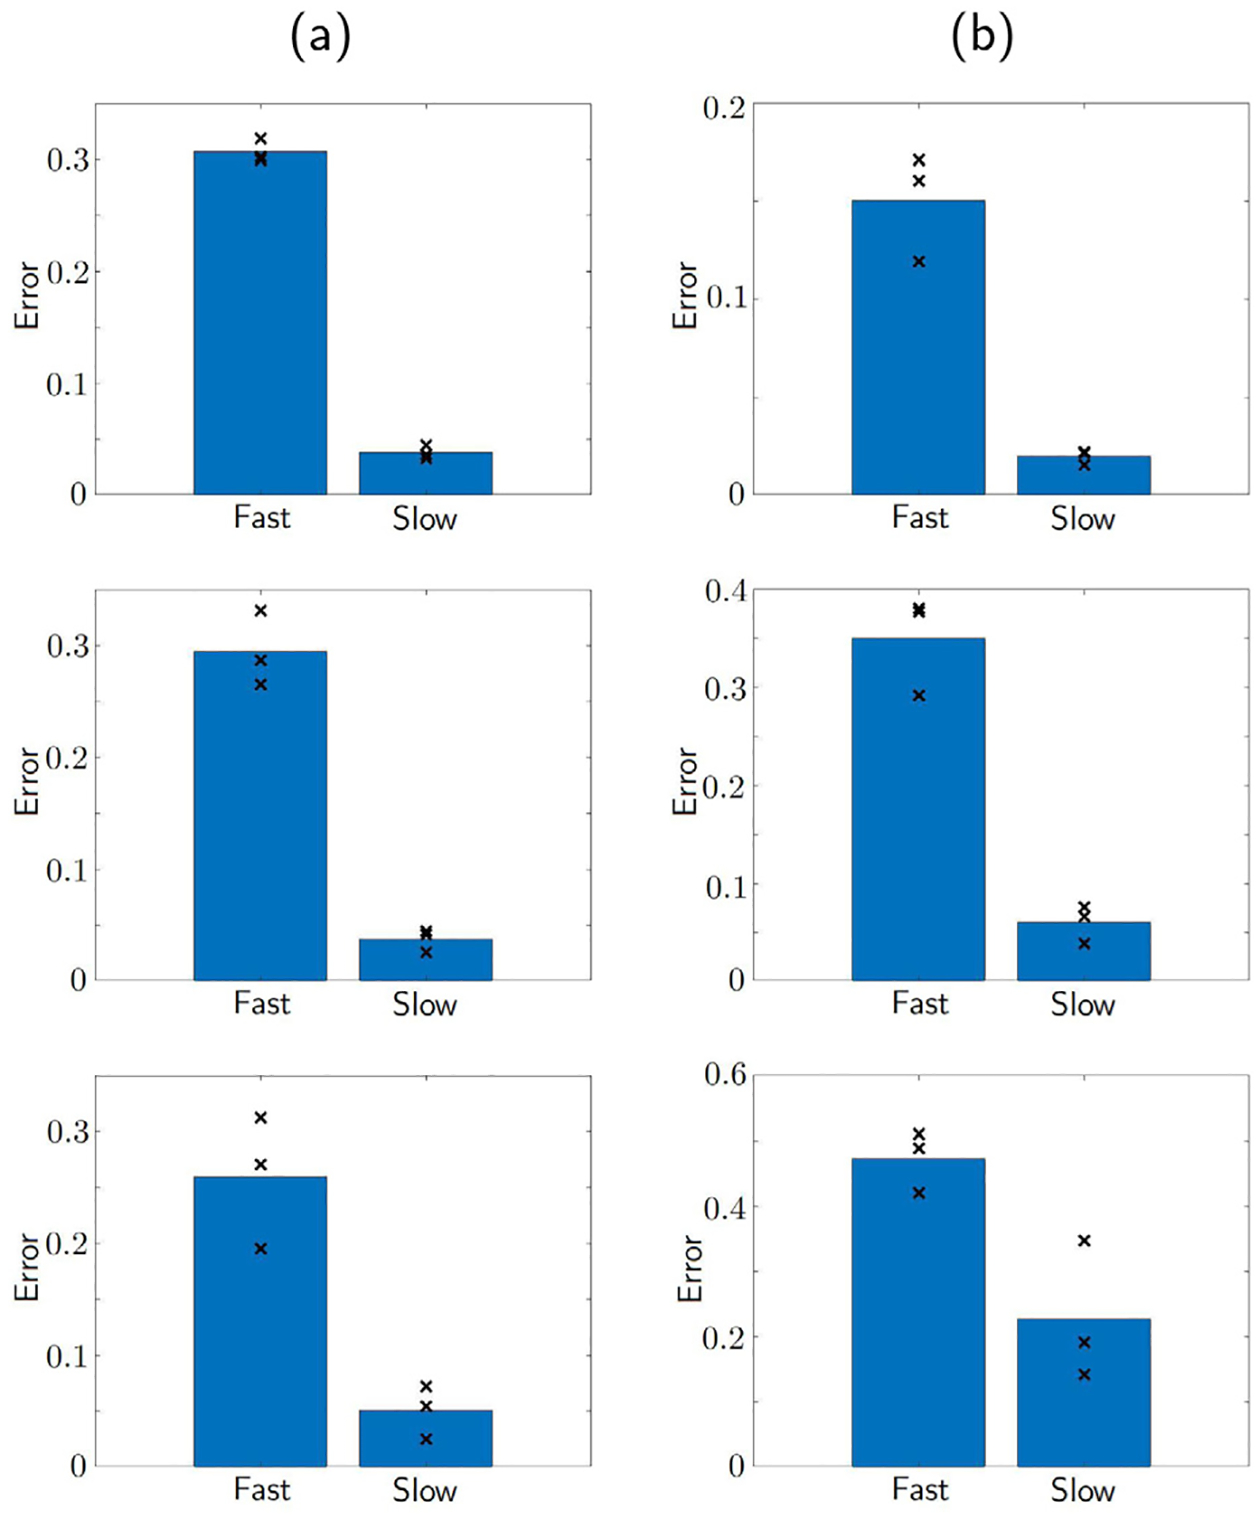
Fig. 5.

Comparison of model fit errors between the fast reaction model Eq. (3) and the slow reaction model Eq. (2). The shown bar plots are the average of the three marked errors (×) for fitting the data of low antigen receptor density glioma (a) and high antigen receptor density glioma (b), with CAR T-cell to cancer ratio 1:5 (top), 1:10 (middle), and 1:20 (bottom). It can be seen that slow reaction model has smaller errors in all cases.
