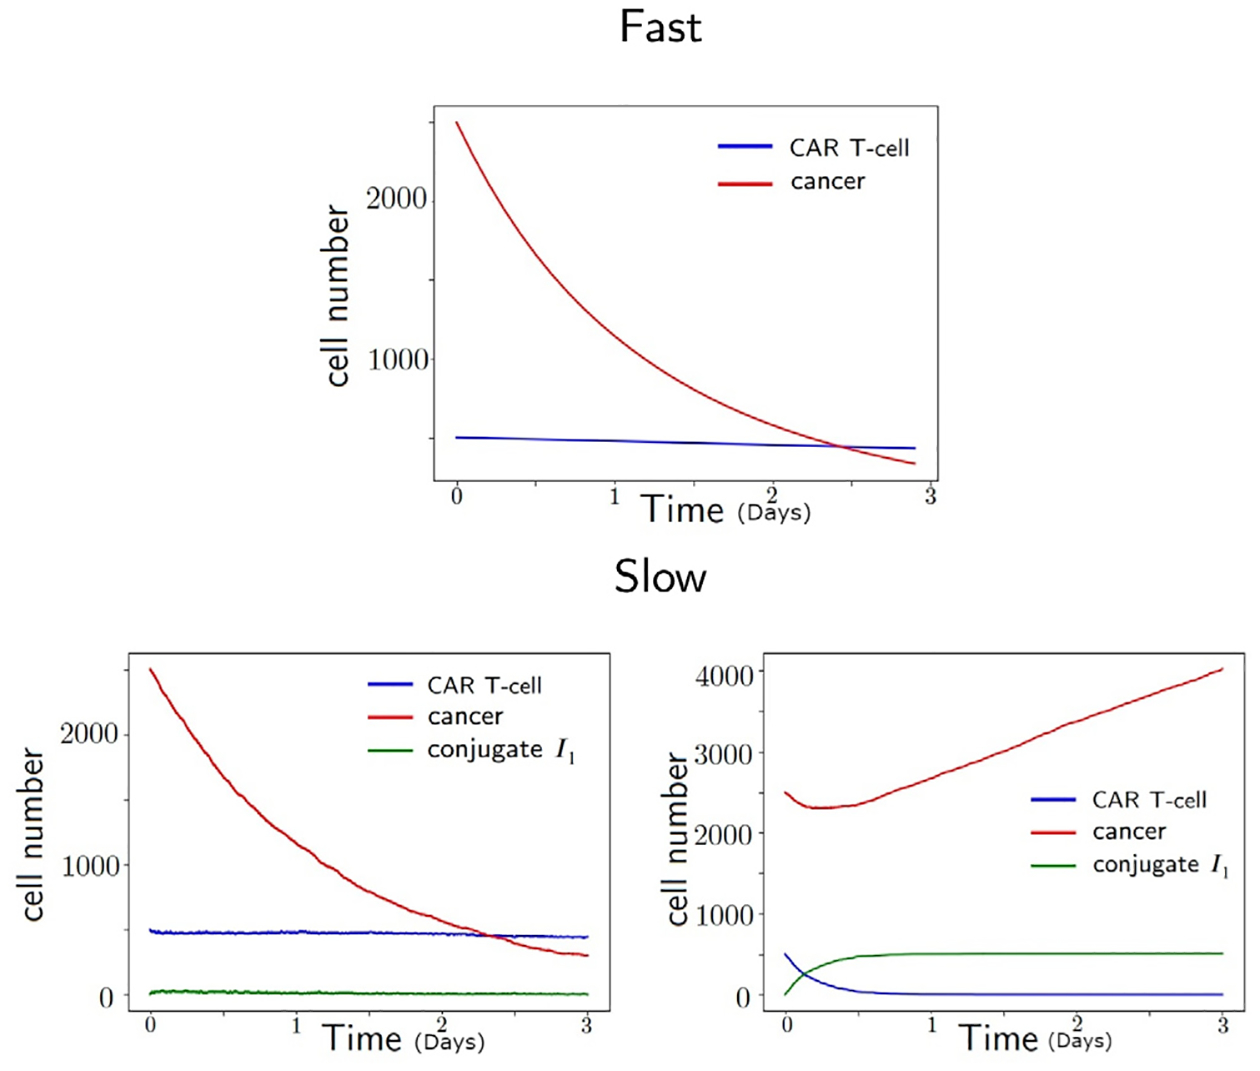
Fig. 6.

Dynamics of cancer, CAR T-cell, and conjugate I1 using two parameter sets of slow reaction model (bottom) that reduces to the same fast reaction model (top) parameter set. The unit of time is in days. When the cancer killing rate is large as (bottom, left), the dynamics of slow and fast reaction models agree. However, when the cancer killing rate is small as (bottom, right), the conjugate I1 have non-trivial dynamics and the dynamics of slow reaction model differs from the fast reaction model.
