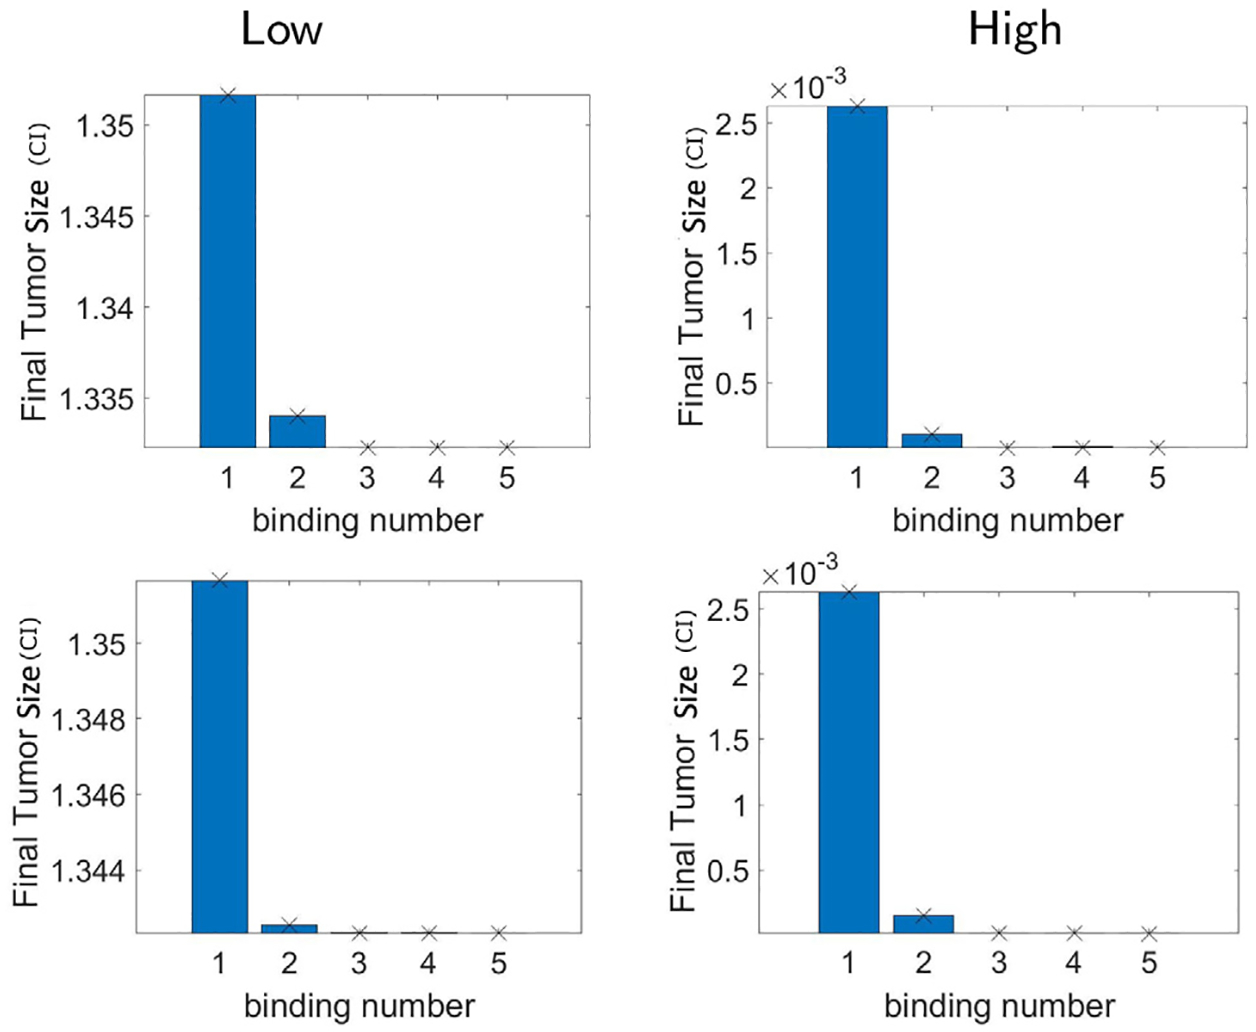
Fig. 9.

Hypothesis 2. Final tumor size (CI) using the n-binding model Eq. (7) assuming up to n number of CAR T-cells binding to glioma cell forming the conjugates I1, …, In. We consider n = 1,2,…,5. The kinetic rate parameters of the multiple CAR T-cells binding model are taken by hypothesis 2 with M = 1, L = 2 (top) and M = 2, L = 2 (bottom). Unlike what we had in hypothesis 1, there is no increase from two bindings to three bindings for all densities, and all results show saturation of final tumor size after three bindings. Thus the relationships between reaction rates that we consider in hypothesis 2 with L > 1 describe the experimental data regarding the cancer antigen density receptor level.
