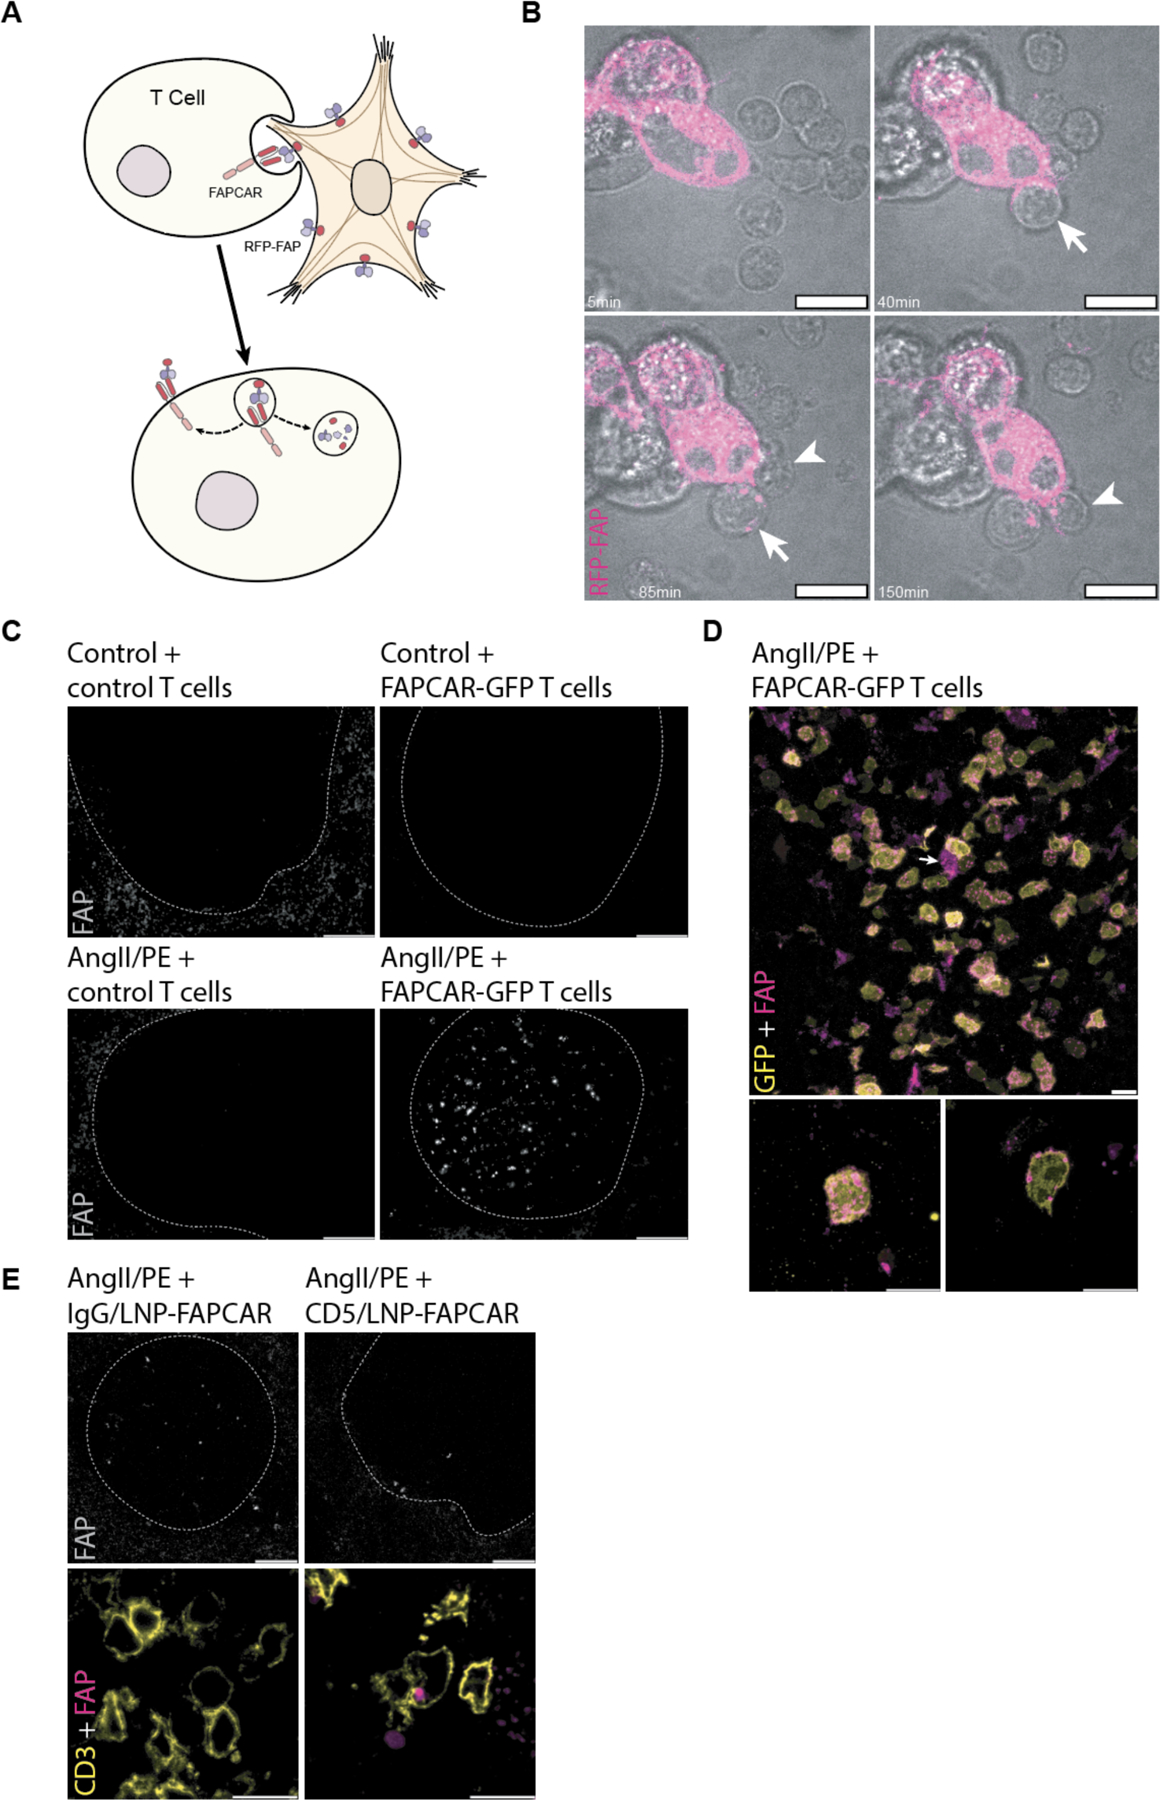
Fig. 3. FAPCAR T cells trogocytose FAP from activated cardiac fibroblasts and return FAP to the spleen only in AngII/PE injured, FAPCAR T-treated animals.

(A) Schematic representation of FAPCAR-expressing T cells trogocytosing FAP from activated fibroblasts. (B) Confocal time-lapse micrographs of two FAPCAR T cells first forming an immunological synapse at 40min (arrow), and 85min (arrowhead) then trogocytosing RFP-FAP (magenta) from HEK293T cells (punctae seen at 85min, arrow, and 150min, arrowhead within FAPCAR T cells). Scale bars: 10μm. (C) Widefield images of FAP-stained spleens (white pulp regions highlighted by the dashed line) of an uninjured animal 24 hours after adoptive transfer of 107 MigR1-control T cells, an uninjured animal 24 hours after adoptive transfer of 107 FAPCAR-GFP T cells, an AngII/PE-injured (7 days) animal 48 hours after adoptive transfer of 107 MigR1-control T cells, and an AngII/PE-injured (7 days) animal 48 hours after adoptive transfer of 107 FAPCAR-GFP T cells. Scale bars: 100μm. (D) Confocal micrograph of FAP (magenta) and FAPCAR-GFP (yellow) in a white pulp region of the spleen of an AngII/PE-injured (7 days) animal 48 hours after adoptive transfer of 107 FAPCAR-GFP T cells. Max-Z projection (lower left subpanel) and a single Z slice (lower right subpanel) of a representative FAP+/FAPCAR+ T cell. Scale bars: 10μm. (E) Confocal micrographs of a white pulp region (dashed outline) of FAP-stained spleens from AngII/PE-injured (7 days) animals injected with 10μg of IgG/LNP-FAPCAR or CD5/LNP-FAPCAR for 48 hours. FAP (grey and magenta) and CD3 (yellow) overlap specifically in CD5/LNP-FAPCAR-treated condition. Scale bars: 100μm (top row; greyscale) or 10μm (bottom row; merged pseudo-colored).
