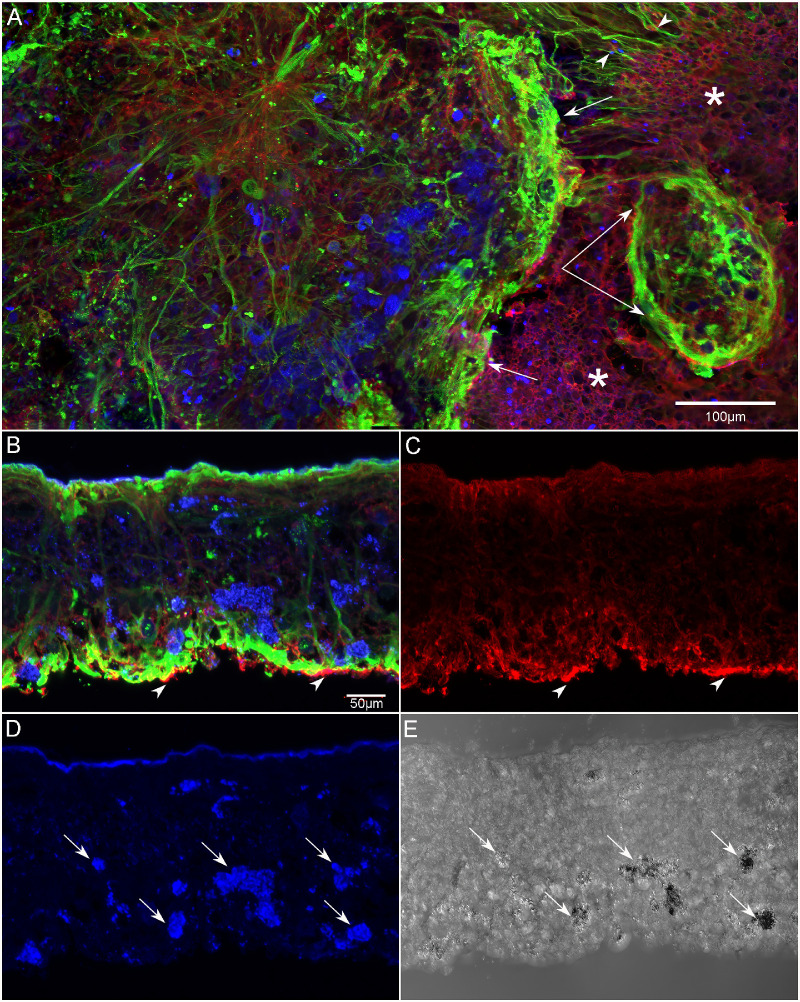
Figure 12.
Subretinal glial membrane at the border of geographic atrophy (patient GA2). The area of atrophy extended into the superior retina in GA2. Retinas were stained with CD44 (red), vimentin (green), and PNA (blue). A glial membrane creates a dense band at the border of RPE atrophy (arrows) and is positive for vimentin and CD44 (A). Blue cells within the membrane appear, based on their pigmentation, to be migrating RPE cells that are either binding PNA or autofluorescing at the 488 wavelength. Outside the glial membrane, the area marked by asterisks, the CD44-positive ELM has a normal staining pattern, and PNA-positive outer segments were observed (blue dots). At the top right, the Müller cell processes extend linearly within the nonatrophic area toward the glial membrane, disrupting the appearance of the ELM (arrowheads). Below this, a smaller, oval-shaped structure created by glial cell processes is also visible (paired arrow). These structures were observed in all three GA donors just outside the atrophic area. After imaging in the flat-mount, a portion of the superior retina was cryopreserved for cross-sectional analysis (B–E). In cross section, the disorganization of Müller cell processes is clearly visible, as is the subretinal glial structure, which is positive for both CD44 and vimentin (arrowheads in B, C). CD44 staining was observed throughout Müller cell processes in the atrophic areas of all three GA donor eyes. In addition, PNA-positive (or autofluorescent at 488 wavelength) cells (arrows in D) are observed throughout the retina (D). DIC imaging demonstrated these cells were pigmented, suggesting they are migrating RPE (E). Scale bars: 100 µm (A) and 50 µm (B–E).

