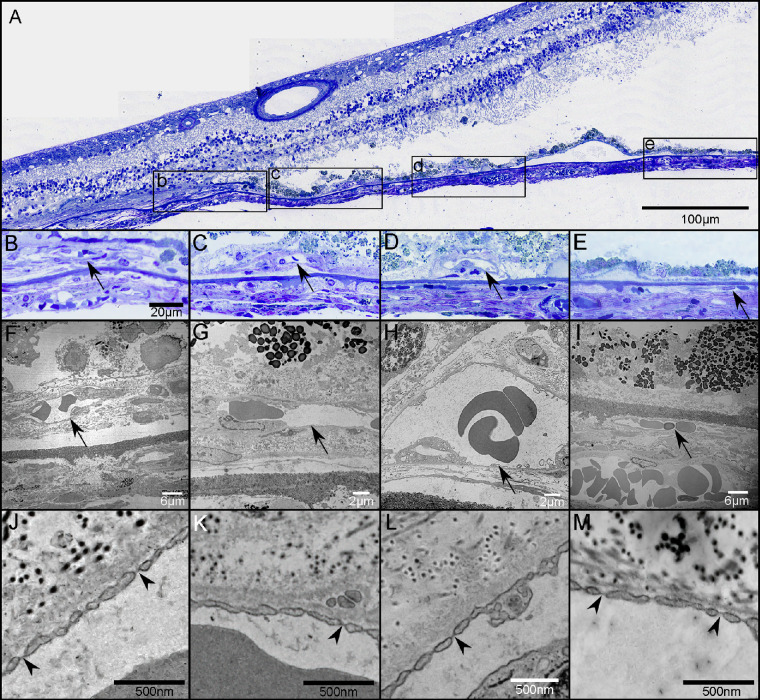
Figure 7.
Choroidal neovascularization in transmission electron micrographs. Thick section of an epoxy embedded region of superior retina/choroid from the atrophic border of G2 (A). Higher magnification of boxed regions in A showing CNV (arrows in B–D) at the border of atrophy (B) and beyond the atrophic border (C, D). There is no CNV in region E. Low-magnification TEM images from the regions shown in B–E showing CNV internal to BM (arrows in F–H) and a choroidal capillary more peripherally (arrow in I). Many of the endothelial cells in the CNV had fenestrations (arrowheads in J–L), some of which appeared typical for those found in surviving CC outside the area of RPE atrophy (arrowheads in M). Scale bars: 100 µm (A), 20 µm (B–E), 6 µm (F, I), 2 µm (G, H), 500 µm (J–M).

