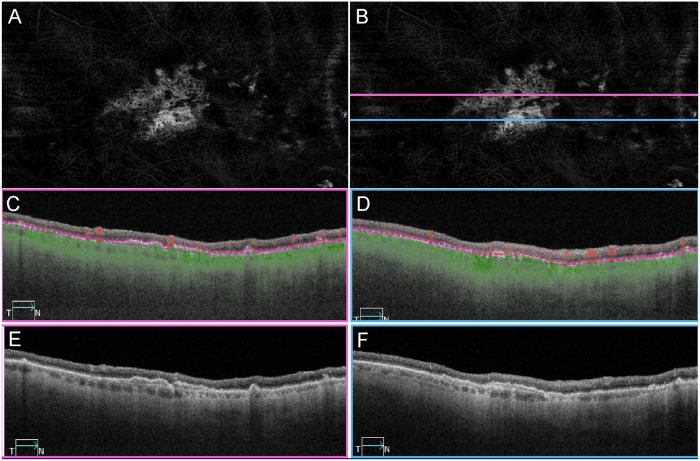
Figure 8.
OCTA imaging of CNV in patient GA2. SS-OCTA en face and B-scan imaging of the same eye in Figures 2A–C and Figure 3 from patient GA2 in 2016. (A) En face angiography image using the RPE to BM slab to illustrate type 1 CNV. (B) Same image as A with lines indicating the B-scan locations. (C, D) Angiographic B-scan images with segmentation lines (purple) corresponding to the RPE and BM. The corresponding locations of the B-scan images were indicated as pink and blue lines in B. (E, F) Structural B-scan images at the same location as in C and D, showing a separation between the RPE and BM, known as a double-layer sign.

