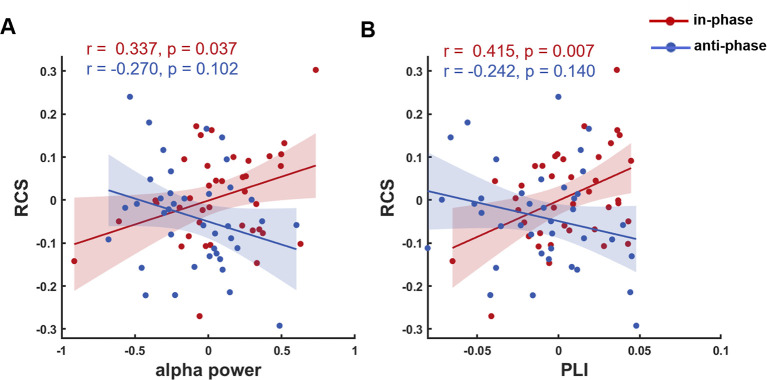
Fig 5. Relationships between tACS-induced changes in RCS and EEG metrics in Experiment 1.
The in-phase tACS-induced changes in RCS were positively correlated with (A) the changes in alpha power, and (B) the changes in PLI; no correlation was found for anti-phase tACS. The RCS, alpha power, and PLI values are given relative to the Baseline values (i.e., after subtracting corresponding Baseline values). The underlying data supporting Fig 5 can be found in the Supporting information as S1 Data. EEG, electroencephalogram; PLI, phase lag index; RCS, rate correct score; tACS, transcranial alternating current stimulation.

