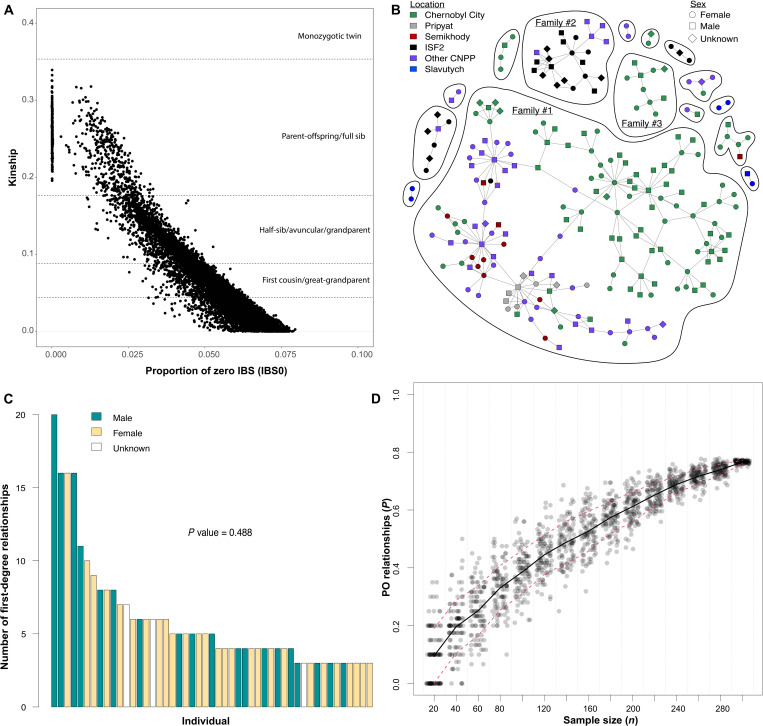
Fig. 3. Identification and analysis of family structure in the Chernobyl dog populations.
(A) Scatterplot showing pairwise kinship relationships among dogs from the Chernobyl populations. Proportion of zero identity-by-state below 0.0004 differentiates parent-offspring relationships. (B) Networks of parent-offspring relationships. (C) Distribution of the number of first-degree relationships for individuals with more than two first-degree family relationships colored to indicate sex. P value corresponds to a Wilcoxon rank sum test used to determine whether there is a significant difference in the number of first-degree family relationships between males and females. (D) Resampling of the Chernobyl dog population to determine the impact of sample size on the discovery of parent-offspring (PO) pairs. The y axis represents the proportion of individuals within the resampled population belonging to a parent-offspring pair.

