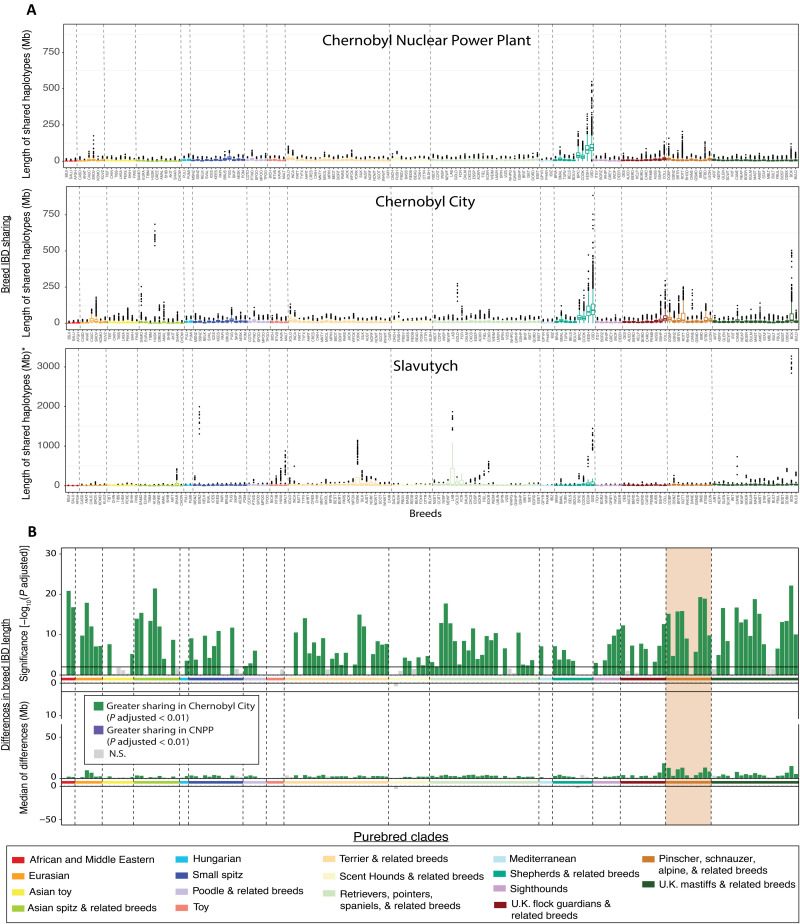
Fig. 4. Differences in breed ancestry between Chernobyl populations.
(A) IBD haplotype sharing with purebred dogs. Each point represents the average length of shared haplotypes of individuals from each population of interest with each breed. *Y-axis scale of the Slavutych plot is different from that of the CNPP and Chernobyl City. The x axis shows abbreviations for each breed comparison defined in table S1. (B) Differences between CNPP and Chernobyl City IBD haplotype sharing with breeds. Each vertical bar represents the −log10(P value) calculated for pairwise comparisons of average sharing between each Chernobyl population and each breed. Vertical bars flipped above the zero line indicate greater average IBD haplotype sharing between dogs from that breed and dogs from Chernobyl City. Breeds are ordered on the x axis according to their placement on a bootstrapped phylogenetic tree found in fig. S2. Breeds are colored according to clade. N.S., not significant.

