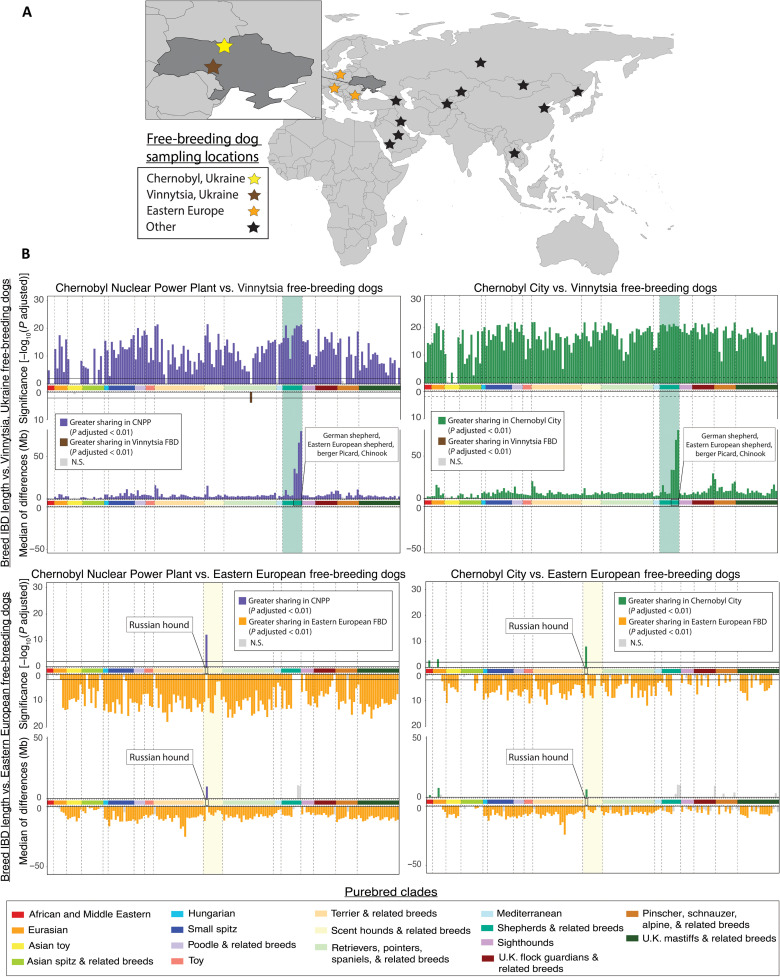
Fig. 6. Breed haplotype sharing of Chernobyl dogs compared to European free-breeding dogs.
(A) Map of approximate free-breeding dog (FBD) sampling locations. See fig. S4 for breed haplotype comparisons to free-breeding dog populations outside of Eastern Europe. (B) Differences in breed IBD haplotype sharing between each Chernobyl population and free-breeding dogs from Vinnytsia, Ukraine. In the plots of significance, each vertical bar represents the −log10(P adjusted value) calculated for pairwise comparisons of average sharing with each breed between one of the Chernobyl populations and free-breeding dogs from Vinnytsia or Eastern Europe. Purple or green vertical bars flipped up on each plot indicate increased haplotype sharing of a breed with one of the Chernobyl populations. Brown or orange vertical bars flipped down indicate increased sharing with Vinnytsia or Eastern European free-breeding dogs, respectively. The black solid line on the plot of significance indicates the threshold for significance at a 99% confidence interval for each comparison. Each vertical bar in the second set of plots represents the median of differences in average breed haplotype sharing between one of the Chernobyl populations and free-breeding dogs from Vinnytsia or Eastern Europe. Plots on the left side of the figure compare average breed haplotype sharing of CNPP dogs to average breed sharing of Vinnytsia or Eastern European free-breeding dogs, while plots on the right side of the figure compare Chernobyl City dogs with Vinnytsia or Eastern European free-breeding dogs. Breeds on the x axis of each plot are ordered according to their placement on a bootstrapped phylogenetic tree found in fig. S3 and grouped by genetic similarity into clades. Horizontal bars are colored according to the purebred clade.

