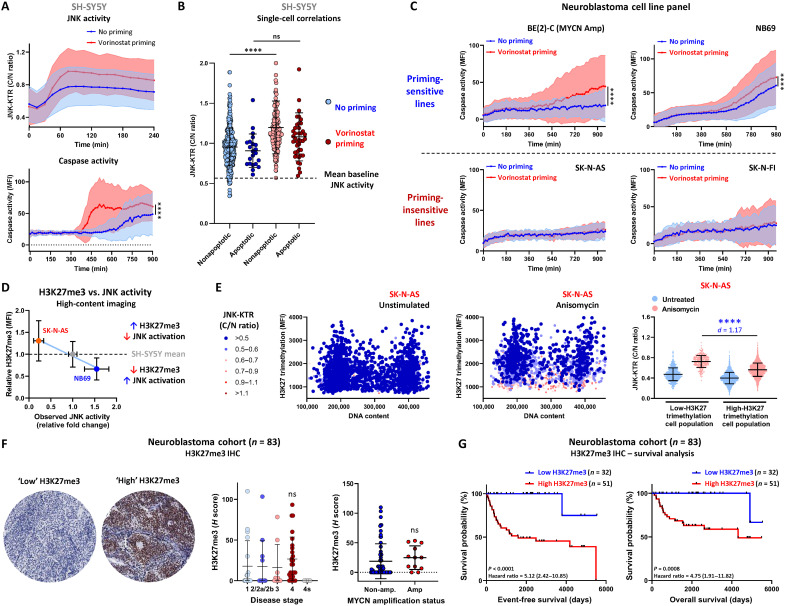
Fig. 5. H3K27me3 is elevated in JNK-impaired cells.
(A) Longitudinal tracking of SH-SY5Y JNK-KTR mRuby2 cells in the presence of NucView 488, pretreated with vorinostat (100 nM; 24 hours) before vincristine stimulation (100 nM). Cells were imaged every 15 min for 15 hours (means ± SD, n = 1114 for no priming and n = 1210 for vorinostat priming, ****P < 0.0001). (B) Peak JNK activity in apoptotic and nonapoptotic cells from the data presented in (A). (C) Longitudinal tracking of the cell lines indicated in the presence of NucView 488, pretreated with vorinostat (100 nM; 24 hours) before vincristine stimulation (100 nM). Cells were imaged every 15 min for 16 hours (means ± SD, n > 840 in all conditions, ****P < 0.0001). (D) Correlation between relative H3K27me3 levels in the NB69, SH-SY5Y, and SK-N-AS lines, obtained by high-content imaging of H3K27me3 antibody staining (means ± SD, n = 2000). (E) High-content imaging of SK-N-AS JNK-KTR mRuby2 cells stained with an H3K27me3 antibody and DAPI nuclear marker following anisomycin stimulation (300 nM; 30 min). For visualization, the JNK-KTR cytoplasmic:nuclear ratio values are displayed in the colored bins as indicated, with the dark blue points indicating the JNK-impaired cells (n = 2000). Raw JNK-KTR cytoplasmic:nuclear ratio values were used for quantification based on a median H3K27me3 cutoff from SH-SY5Y cells (means ± SD, n = 2000 for untreated and n = 2000 for anisomycin, ****P < 0.0001). (F) Immunohistochemistry staining for H3K27me3 in a tumor microarray cohort of 83 pretreatment neuroblastoma patient samples. Two representative images of low and high H3K27me3 are shown, along with the correlation between H3K27me3 staining and disease stage or MYCN amplification status of each tumor. (G) Overall and relapse-free survival analysis in this cohort based on H3K27me3 expression. Samples with an H score of >0 were considered “high H3K27me3.”

