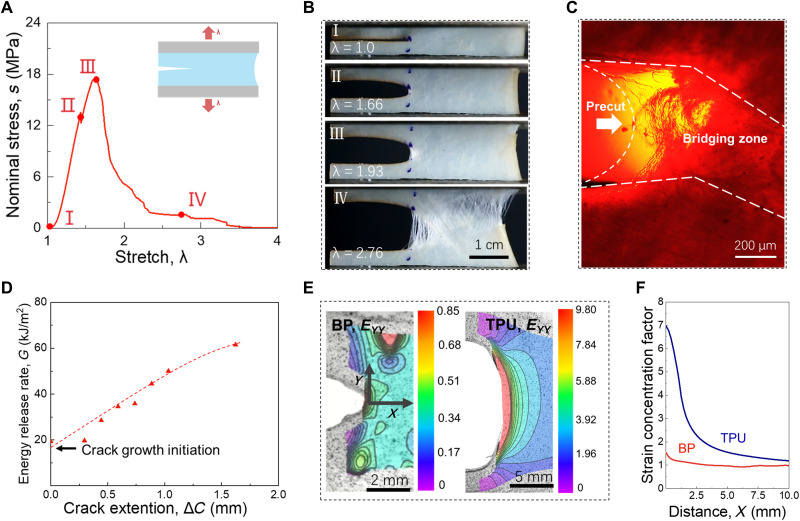
Fig. 5. Fracture and deconcentration of strain.
(A) The stress-stretch curve. (B) Snapshots of a membrane with a precut in four states of deformation. (C) A polarized light micrograph of the crack tip. (D) The resistance curve. (E) Contours of strain EYY observed using DIC. Both BP and TPU are imaged for comparison. (F) The concentration factor of strain EYY at distance X from the crack tip measured in the undeformed state. In the fracture test, the number of samples, n = 3. Thickness of samples, t = 0.31 ± 0.04 mm (means ± SD).

