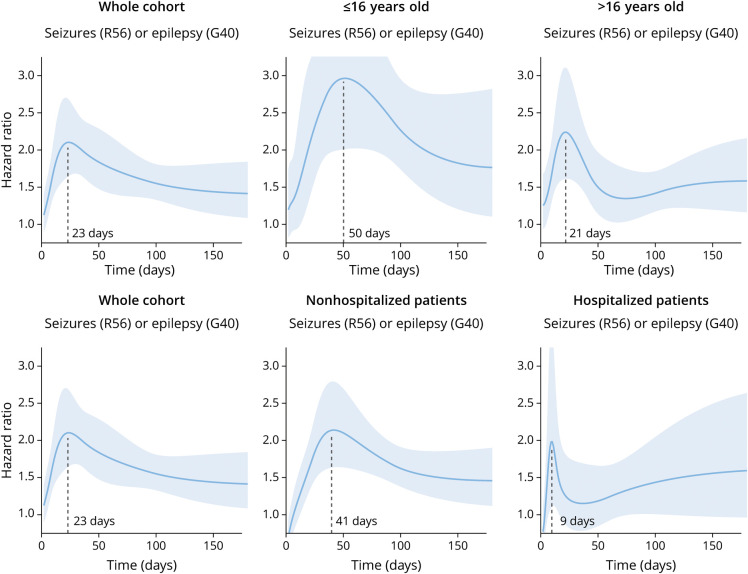
Figure 4. Time-Varying Hazard Ratios for the Primary Analysis (Left) and Nonhospitalized/Hospitalized and Pediatric/Adult Subgroups.
The time of the peak HR is noted on the x-axis. The left-most panel in each row is identical to facilitate comparison. The peak HR in the whole cohort is at 23 days, similar to that seen in those older than 16 years. In those younger than 16 years, the peak is delayed to 50 days and, at that point, the HR is nearly 3.0. Hospitalized patients show a peak HR at 9 days, while in nonhospitalized patients, the peak HR is at 41 days.

