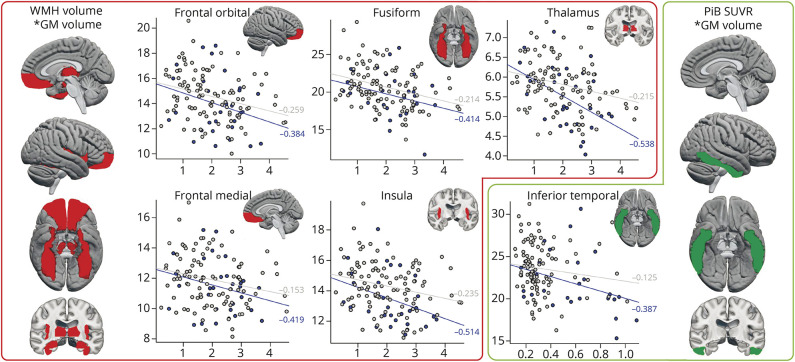
Figure 5. Brain Maps and Scatter Plots of Associations of WMH and PiB With Regional GM Volume in DLB.
Side brain maps give an overall overview of the regions that were statistically significant in univariate analysis (partial Spearman correlations for PiB SUVr and WMH volume with regional GM volume). The scatter plots show the associations between log transformed PiB SUVr or log transformed WMH volume with regional GM volume, separately for DLB patients (blue dots and blue regression lines) and CU individuals (gray dots and gray regression lines). Spearman correlation coefficients (partial) are displayed by the regression lines. Abbreviations: CU = cognitively unimpaired; DLB = dementia with Lewy bodies; GM = gray matter; PiB = Pittsburgh compound B; SUVr = Standardized uptake value ratios, WMH = white matter hyperintensities.

