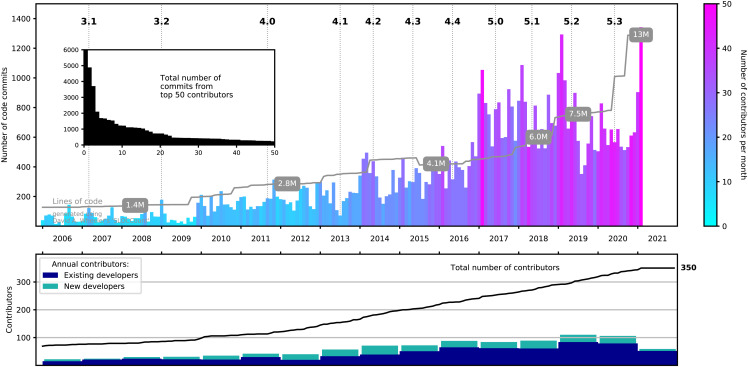
FIG. 2.
Statistics showing Q-Chem developer activity since 2006. Top: total number of code commits, organized chronologically by month. The color of each monthly entry indicates the number of individual developers who made commits. (Light blue is single-digit numbers, and the January 2021 peak represents about 50 developers committing code that month.) Bottom: growth of the developer base broken down into existing developers vs those who committed code for the first time. The inset depicts the total number of commits by the 50 most prolific developers.

