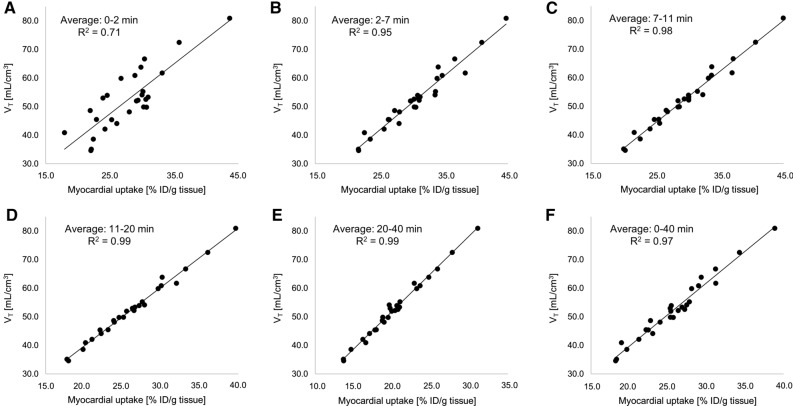
Figure 3.
Resting state (no regadenoson) correlations of image-derived myocardial 18F-flurpiridaz uptake (%ID/g tissue), averaged at different time intervals, with tissue volume of distribution (VT). Early time intervals revealed lower R2 values, while later time intervals reached an R2 value of up to 0.99, indicating an excellent correlation between VT and %ID/g tissue 18F-flurpiridaz. Averaged time intervals included (A) 0-2 min, (B) 2-7 min, (C), 7-11 min, (D) 11-20 min, (E) 20-40 min and (F) 0-40 min post injection

