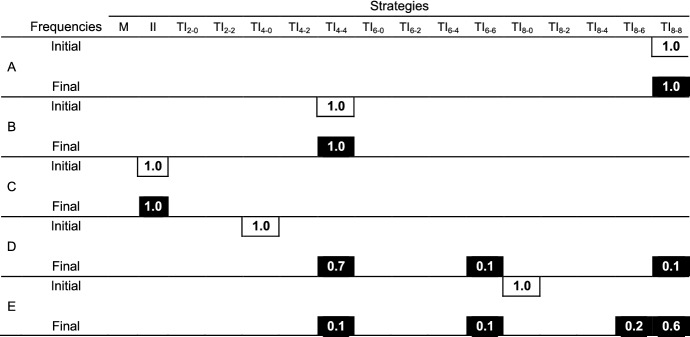
Table 2.
Evolutionary dynamics of all strategies with the random mutations
Evolutionary dynamics of all strategies with the random mutations that take place in two loci with a probability of μ (= 0.001) independently; one is for x and the other is for y in TIx–y. Each case, A, B, C, D, and E has a different initial strategy frequency. Initial strategy frequencies are as follows; A with TI8–8 = 100%, B with TI4–4 = 100%, C with II = 100%, D with TI4–0 = 100% and E with TI8–0 = 100%. Numbers in each cell represent the strategy frequencies at the start (upper row) and the end (lower raw) for each case, as averages over 50 times. Each run ends up with 100% of the most dominant strategies and no coexistence of strategies. Final strategy frequencies represent how often the respective strategies become the most dominant strategy. We calculate an average of final frequencies only when the survival strategy converges into a single strategy. The numbers in cells are rounded and sum of the numbers may not be 1 because of the rounding. We examine cases with two different C/V ratios (1.25 and 4). Here we use N = 40, G = 10 000, μ = 0.001, MC = 14, C = 30 and V = 4

