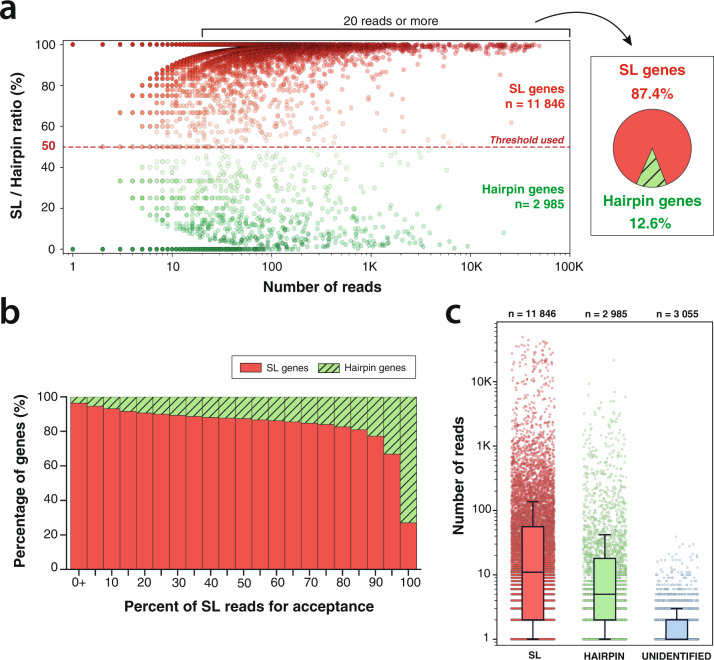
Fig. 5. Quantitative analysis of trans-splicing prevalence.
a For each gene, we measured the ratio of SL/Hairpin reads at the most expressed starting mRNA position. For genes with at least 20 reads at their most expressed position, we represent the proportion of genes that have a majority of SL reads. b Proportion of trans-spliced gene with various SL thresholds. c Read coverage for genes majoritarily trans-spliced (SL), most with terminal self-complementarity (hairpin) or with unknown 5’ status (unidentified). Boxes show the quartiles of the dataset while the whiskers extend to show the rest of the distribution, except for points that are determined to be “outliers” using a method that is a function of the interquartile range (python seaborn library).

