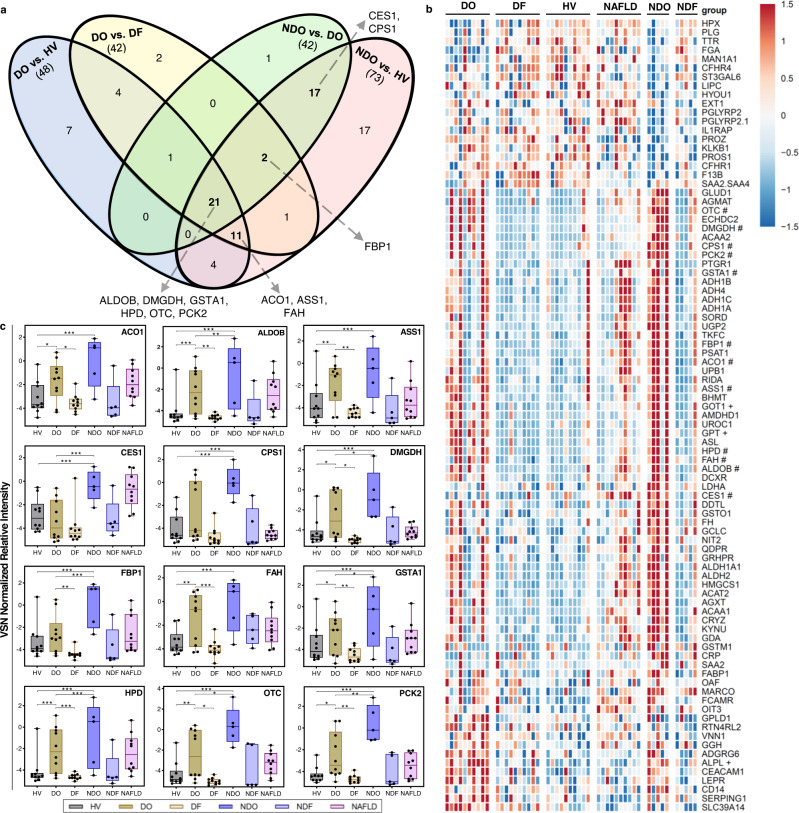
Fig. 2. Discovery proteomics to identify candidate biomarkers.
a Venn diagram showing statistically significant differentially expressed, liver-enriched proteins (p-value <0.1, two-sided and Benjamini-Hochberg-adjusted) between DILI onset (DO, n = 10) and healthy volunteer (HV, n = 10) samples, DO and DILI follow-up (DF, n = 10) samples, DO and non-DILI onset (NDO, n = 5), NDO and HV. The arrows indicate the liver-enriched candidate biomarkers selected from each group-wise comparison. b Heatmap of the 89-liver enriched, differentially expressed proteins (encoded by 88 genes) between all the 6 groups; + indicates the traditional biomarkers and # indicates selected candidate biomarkers. The variance stabilizing normalization (VSN) normalized expression data were converted to z-scores by row and represented with a color scheme ranging from -1.5 (blue), 0 (white), 1.5 (red), in 101 color step gradients. Row-wise, white represents values at the mean, with red and blue representing values of at least 1.5 standard deviations above or below the mean, respectively. c VSN normalized relative expression of candidate biomarkers identified from the analysis (two-sided and Benjamini-Hochberg-adjusted) shown in a, HV (n = 10), DO (n = 10), DF (n = 10), NDO (n = 5), NDF (n = 5) and NAFLD (n = 10). The center line in the box corresponds to the median, the box represents the first and third quartiles, and the whiskers represent the minimum and maximum observed values. *P < 0.1; **P < 0.01; ***P < 0.001. Source data are provided as a Source Data file.

