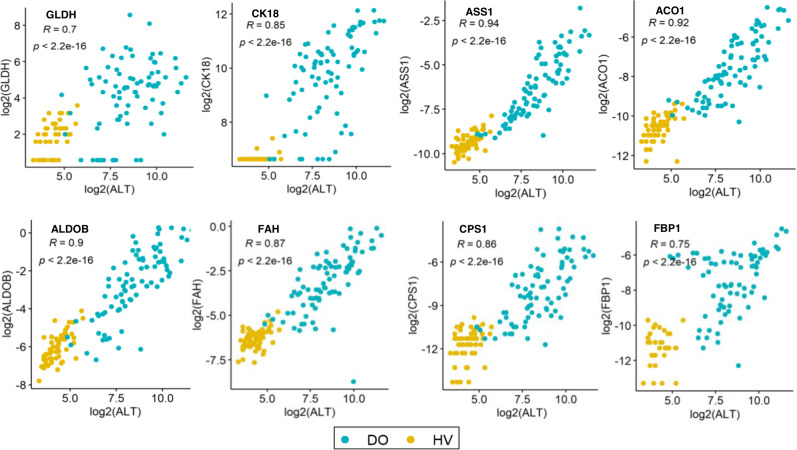
Fig. 5. Correlation between biomarkers and ALT.
Spearman’s r correlation coefficient (R) (test R = 0 or not, two-sided, no adjustment) was calculated between ALT and either previously identified biomarkers (glutamate dehydrogenase (GLDH) and cytokeratin-18 (CK18)) or candidate biomarkers. Circles indicate HV (n = 60) and DO (n = 82) samples from the confirmatory cohort. Values are log2 transformed and p values are shown. Source data are provided as a Source Data file.

