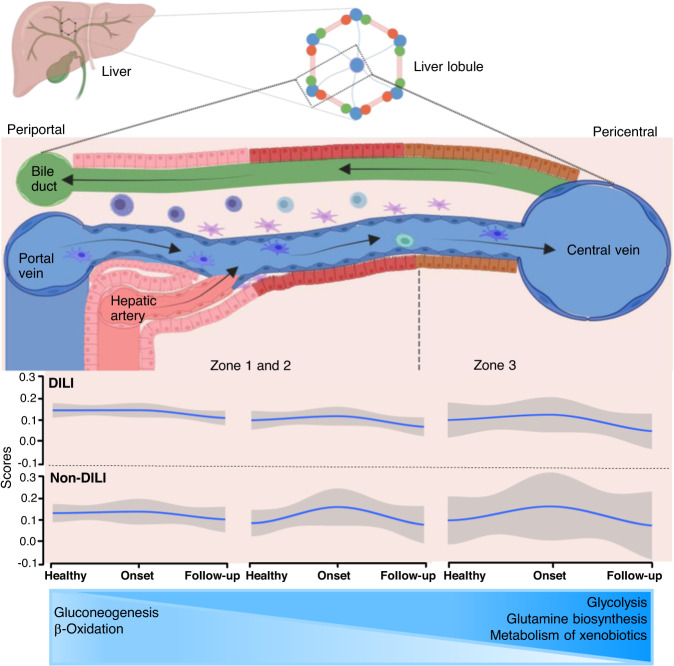
Fig. 6. Visualization of liver pathway signatures.
Visualization of apparent differences in liver zone pathway signatures among NDO, DO, and HV, using single sample gene set enrichment analysis of the discovery proteomics dataset. Pathway enrichment from differentially expressed genes between NDO (n = 5) and HV (n = 10), and NDO and DO (n = 10) shown in Supplementary Fig. 6. Pathway scores are calculated from expression data for each gene set to allow side-by-side visualization. Healthy volunteers (HV) scores were combined with DILI onset and follow-up (DO and DF (n = 10)) or with non-DILI onset and follow-up (NDO and NDF (n = 5)) to simulate transition through healthy, onset, and follow-up in either DILI or non-DILI disease. The structure of individual lobules in the liver is represented having parenchymal cells (hepatocytes) and multiple non-parenchymal cells aligned between a capillary network and a central vein and liver interzonal signature expression plotted below the lobule zones. Smooth lines were generated by loess method, gray indicates standard deviation. Zonal expression levels of differentially expressed proteins which are involved in gluconeogenesis, β-oxidation, glycolysis, glutamate biosynthesis, and xenobiotics metabolism is illustrated below the graphs. Image was made with BioRender (# FR23R67B3Z). Source data are provided as a Source Data file.

