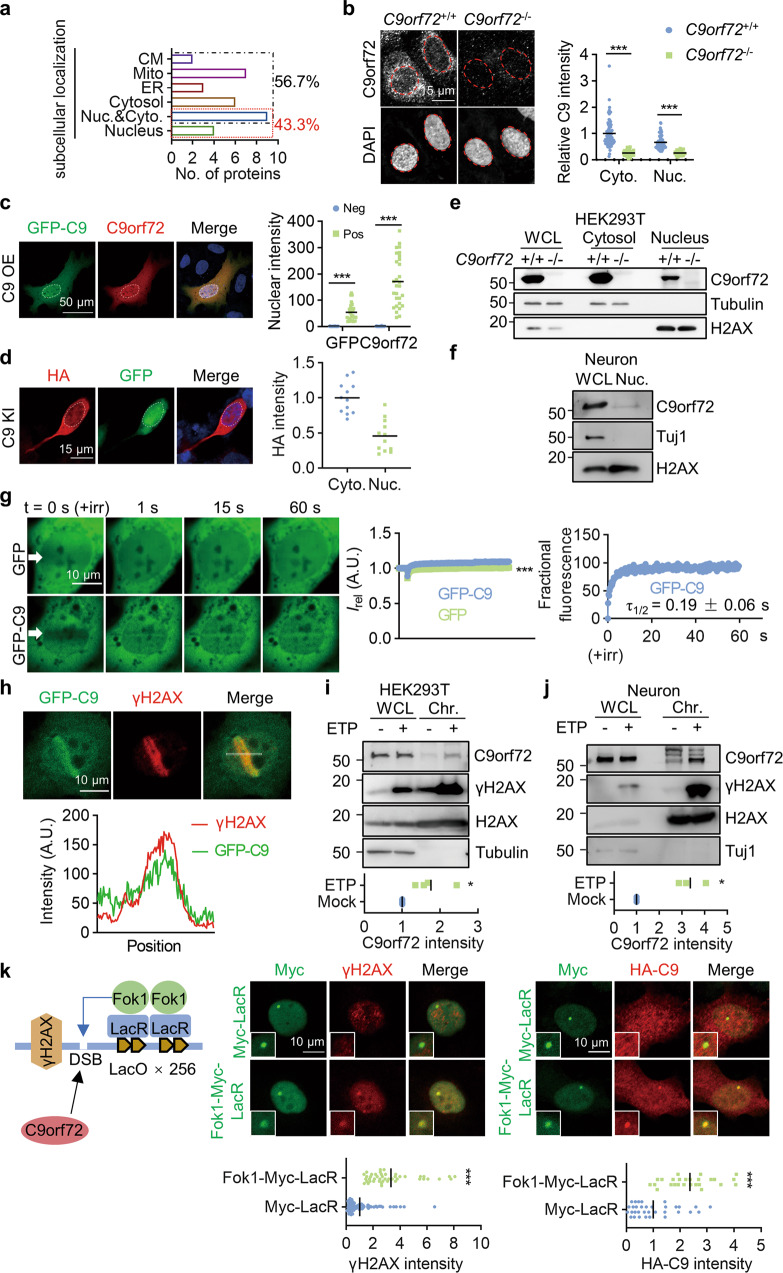
Fig. 1. Accumulation of nuclear C9orf72 at DSB sites.
a Diagram showing subcellular localization of proteins identified as potential C9orf72 binding proteins by IP-MASS analysis. CM, cell membrane; Mito, mitochondria; ER, endoplasmic reticulum. b, c C9orf72 localized to the nucleus and cytosol in cells. b The endogenous C9orf72 was stained with anti-C9orf72 antibody (GTX632041) in WT and C9orf72 KO U2OS cells. Red circles indicate the nuclei (left). Quantitative analysis of C9orf72 intensity in the cytosol and nucleus (right). Data are mean (n = 63-96 cells from 3 independent experiments; unpaired t-test; ***, p < 0.001). c The C9orf72 KO U2OS cells were transfected with GFP-C9orf72. The localization of GFP-C9orf72 was revealed by anti-GFP and anti-C9orf72 (GTX632041) antibodies. White circles indicate the nuclei (left). Quantitative analysis of C9orf72 intensity in the nucleus (right). Data are mean (n = 29 cells from 3 independent experiments; unpaired t-test; ***, p < 0.001). d The HA tag was inserted into endogenous C9orf72 gene in HEK293T cells by CRISPR-Cas9. The localization of C9orf72 was revealed by anti-HA antibody, and cells transfected with CRISPR construct were indicated by GFP. White circles indicate the nuclei (left). Quantitative analysis of HA intensity (right). Data are mean (n = 12 cells from 3 independent experiments). e, f Nuclear localization of endogenous C9orf72 was revealed by subcellular fraction analysis in HEK293T cells (e) and neurons (f) (n = 3 independent experiments). g Accumulation of GFP-C9orf72 protein at sites of DNA DSB. The U2OS cells were transfected with the constructs encoding GFP or GFP-C9orf72. Two days after transfection, cells were stained with Hoechst and subjected to laser-generated DNA lesion by a 405 nm laser (+irr). Time-lapse images of the transfected cells were taken by a confocal microscope. White arrows indicate the damaged regions of interest (ROI) (left). Quantitative analysis of relative fluorescence intensity (Irel) as a function of time at lesioned ROIs for U2OS cells transfected with GFP (green) or GFP-C9orf72 (blue) (middle) (right). Data are mean (n = 12–16 cells from 3 independent experiments; Two-way ANOVA; ***, p < 0.001). h GFP-C9orf72 co-localized with γH2AX in U2OS cells after DNA DSB induction. U2OS cells transfected with GFP-C9orf72 were fixed immediately after laser-induced DNA damage and stained with anti-γH2AX antibody. The fluorescence-intensity profile of GFP-C9orf72 (green) and γH2AX (red) were obtained along the white line. i, j Increased C9orf72 in the chromatin fraction after DNA damage. HEK293T cells (i) and neurons (j) were treated with ETP (10 μM) for 4 h. The whole cell lysate (WCL) and chromatin fraction (Chr.) were isolated for immunoblotting analysis. Quantitative analysis of C9orf72 intensity in the chromatin fraction. Data are mean (n = 3-4 independent experiments; paired t test; *, p < 0.05). k Schematic diagram of the LacO/LacR (Lac operator/Lac repressor) system to analyze recruitment of C9orf72 on chromatin after DNA DSB (left). U2OS LacO cells contain Lac operator array in the genome to tether LacR protein at LacO array. U2OS LacO cells were transfected with Fok1-LacR to tether the nuclease Fok1 at LacO array to generate DNA DSB. U2OS LacO cells expressing Fok1-Myc-LacR or Myc-LacR, together with HA-C9orf72 were stained with anti-γH2AX (middle) (n = 45-88 cells from 3 independent experiments) or anti-HA (right) (n = 26-33 cells from 3 independent experiments) antibodies. Quantitative analysis of γH2AX intensity or HA-C9orf72 intensity. Data are mean (unpaired t-test; ***, p < 0.001).

