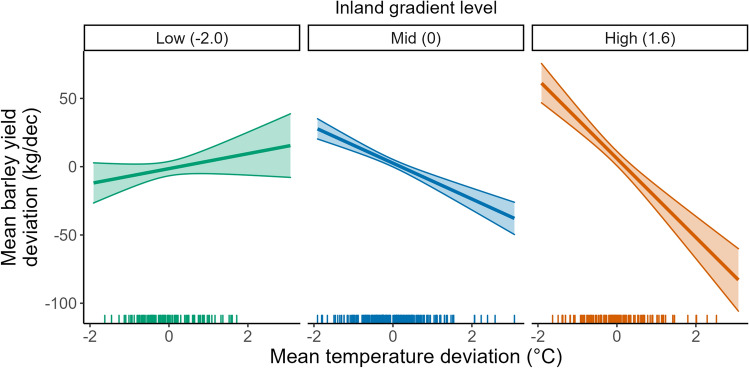
Figure 3.
Predicted relationship between mean temperature deviation and mean barley yield deviation for varying levels of the Inland gradient. The three graphs are drawn at the 10th, 50th and 90th percentile for the Inland gradient. Higher values for this gradient are associated with distance from the coast and cooler winter temperatures. Regression lines show the predicted yield deviation from the LMM when all other predictors are held constant at mean values. Shaded areas are ± 1 SE.

