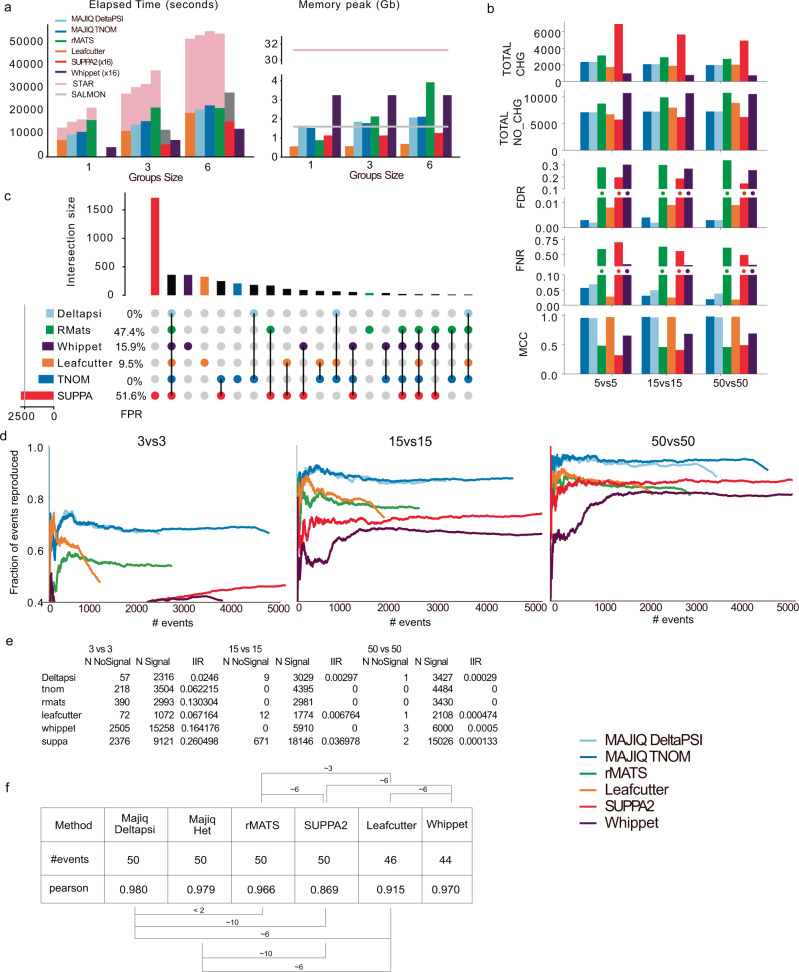
Fig. 2. Performance evaluation using synthetic and real data.
a Time (left) and memory (right) consumption for running all pairwise differential splicing analysis between 10 GTEx tissue groups, with number of samples per group increasing from 1 to 6 (x-axis). The “x(16)” label denotes a parallelization script added to methods not supporting multithreading. b Performance evaluation, aggregated over genes, for differential splicing calls using simulated GTEx samples (cerebellum and skeletal muscle). Metrics include the total number of genes reported as changing (TOTAL-CHG) or non-changing (TOTAL-NO-CHG), with the resulting FDR, FNR, and Matthew’s correlation coefficient (MCC). Horizontal axis denotes set size. c Upset plot based on the 10vs10 analysis shown in b. The bars on top represent the overlap between genes reported as differentially spliced by each method indicated below. The bars and FPR values by each method’s name refer to genes reported only by that method. d Reproducibility ratio (RR) plots for real data, using GTEx cerebellum and muscle samples. Plots are based on each method’s reported list of splicing events (not genes) and unique scoring approach. X-axis is the ranked number of events reported and Y-axis is the fraction of those events reproduced within the same number of top-ranking events when repeating the analysis using a different set of samples from the same tissues. Line length represents the total number of differentially spliced events reported (see “Methods” for details). RR graphs are shown for group sizes of 3 (left), 15 (middle), and 50 (right). e Intra-to-Inter Ratio (IIR) results for GTEx samples as in d. IIR is the ratio between the number of events reported as significantly changing when comparing two sample groups of the same type (“NoSignal” column) and the number of events reported as significantly changing when comparing groups of different types (muscle versus cerebellum, as in d). f Correlation between estimated dPSI and RT-PCR quantification of splicing changes. RT-PCR results taken from ref. 3 based on mouse liver and cerebellum RNA, extracted by ref. 46 for the matching RNA-Seq samples. All splicing events examined are annotated cassette exons. Two-sided p values based on the Dunn and Clark’s z procedure estimated via ref. 47.

