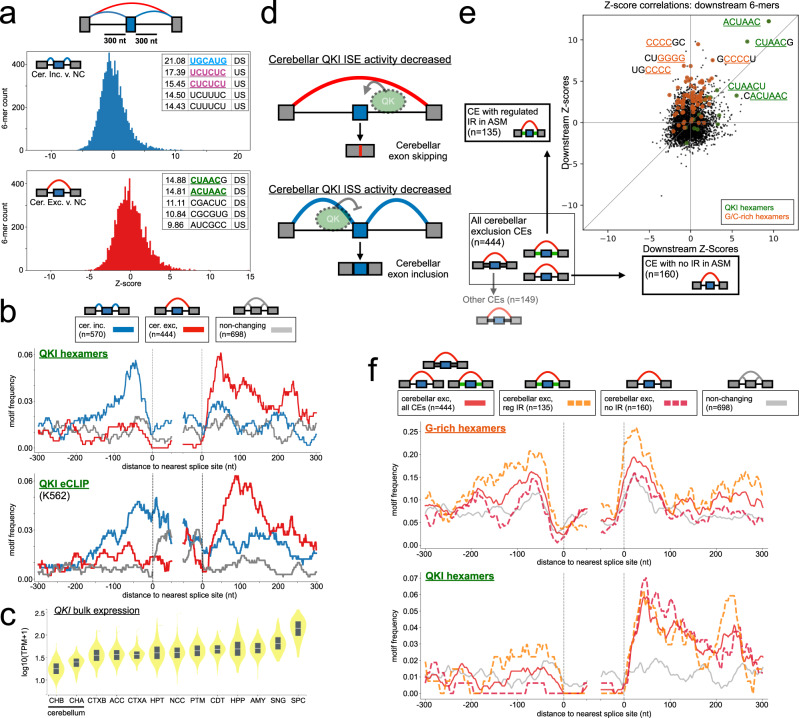
Fig. 6. Regulatory analysis of simple and complex cerebellar cassette exon types.
a Distribution of hexamer Z-scores within 300 nucleotides upstream or downstream of all CE event types (Fig. 5c) for cerebellar inclusion versus non-changing (top, blue) or cerebellar exclusion versus non-changing (bottom, red) (see “Methods”). Top motifs for RBPs of interest are highlighted (QKI (green), RBFOX (blue), SRRM4 (yellow), SRSF11 or PTB (purple)). All motifs and Z-scores are given in Supplementary Data 1. b RNAmaps showing the frequency of QKI hexamers (ACUAAY, top) or binding of QKI (K562 eCLIP peaks, bottom) around cerebellar inclusion (blue), exclusion (red), or non-changing (gray) CEs. Frequencies calculated over windows of 20 nucleotides smoothed by a running mean of 5 nucleotides. c GTEx QKI brain tissue expression () generated using gtexportal.org. Violins represent the distribution of values, boxes represent the 25th and 75th percentiles, white lines represent medians, and outliers beyond 1.5 times the interquartile range are shown. Each tissue is represented by no fewer than 109 samples. Abbreviations are defined in Fig. 5a. d Model for QKI position-dependent regulation in GTEx brain tissues. Decreased expression of QKI in cerebellar tissues results in decreased downstream intronic splicing enhancer (ISE) activity, resulting in cerebellar exon exclusion (top). Decreased upstream intronic splicing silencer (ISS) activity results in cerebellar exon inclusion (bottom). e Scatter plot showing hexamer Z-score correspondence for non-overlapping sets of cerebellar CE exclusion events: (y-axis) CE exclusion events from AS modules containing changing intron retention (IR) event(s) versus non-changing and (x-axis) CE exclusion events from AS modules without IR event(s) detected. Motifs of interest are highlighted according to colors in the inset. f RNAmaps (plotted as in b) for given cerebellar CEs stratified by intron status for G-rich hexamers (five of six positions are G and contains GGGG, top) or QKI hexamers (ACUAAY, bottom). Red lines, all cerebellar exclusion CEs; orange dashed, subset of exclusion CEs with changing IR; fuchsia dashed, subset of exclusion CEs with no IR; gray, all non-changing CEs.

